Brazilian vs Immigrants from Hong Kong Hearing Disability
COMPARE
Brazilian
Immigrants from Hong Kong
Hearing Disability
Hearing Disability Comparison
Brazilians
Immigrants from Hong Kong
2.9%
HEARING DISABILITY
78.7/ 100
METRIC RATING
146th/ 347
METRIC RANK
2.7%
HEARING DISABILITY
99.2/ 100
METRIC RATING
51st/ 347
METRIC RANK
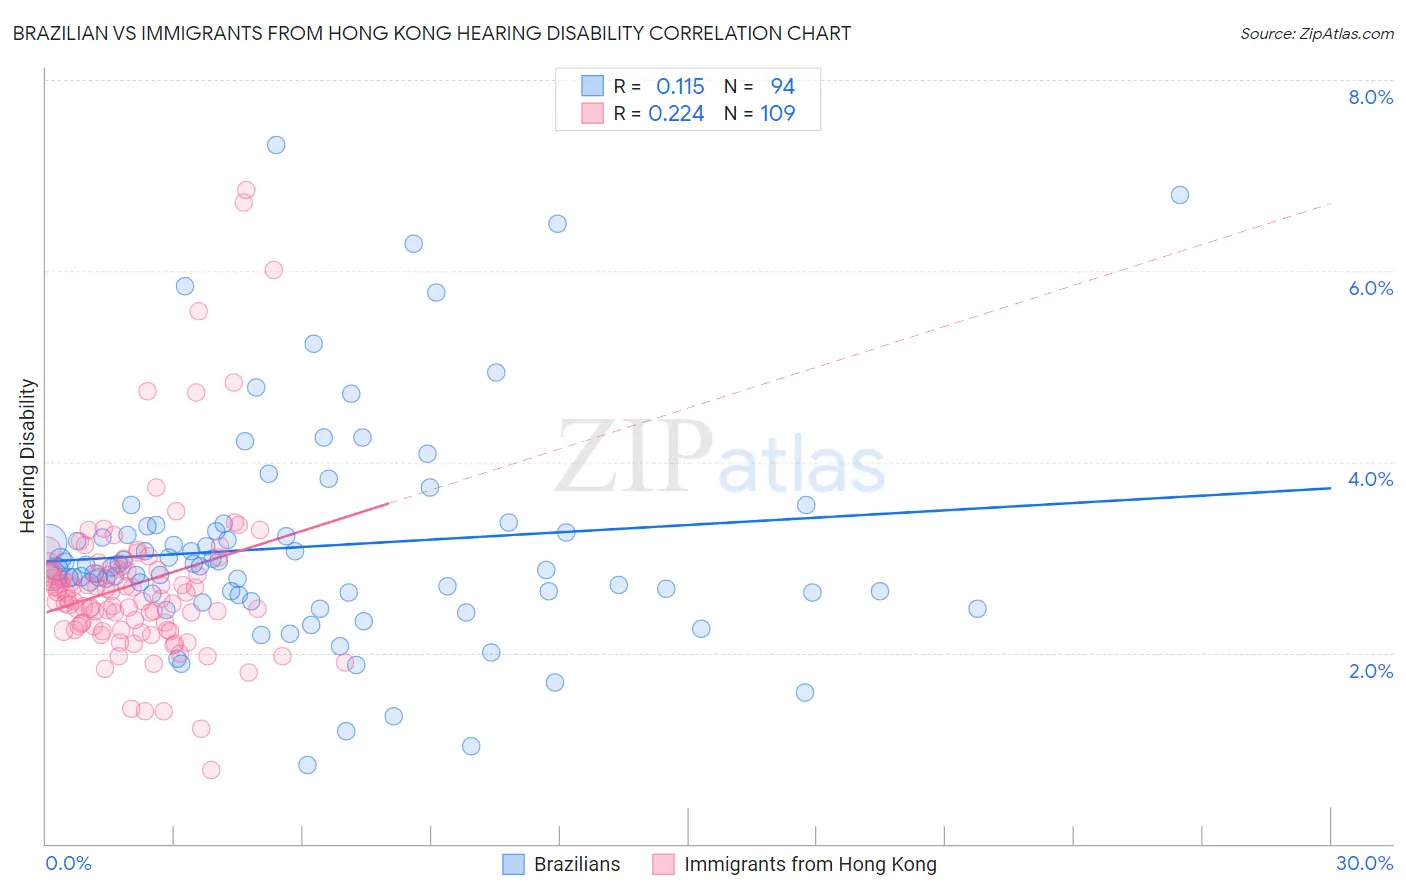
Brazilian vs Immigrants from Hong Kong Hearing Disability Correlation Chart
The statistical analysis conducted on geographies consisting of 323,867,149 people shows a poor positive correlation between the proportion of Brazilians and percentage of population with hearing disability in the United States with a correlation coefficient (R) of 0.115 and weighted average of 2.9%. Similarly, the statistical analysis conducted on geographies consisting of 253,945,747 people shows a weak positive correlation between the proportion of Immigrants from Hong Kong and percentage of population with hearing disability in the United States with a correlation coefficient (R) of 0.224 and weighted average of 2.7%, a difference of 9.1%.
Hearing Disability Correlation Summary
| Measurement | Brazilian | Immigrants from Hong Kong |
| Minimum | 0.82% | 0.77% |
| Maximum | 7.3% | 6.9% |
| Range | 6.5% | 6.1% |
| Mean | 3.1% | 2.7% |
| Median | 2.9% | 2.6% |
| Interquartile 25% (IQ1) | 2.6% | 2.3% |
| Interquartile 75% (IQ3) | 3.3% | 2.9% |
| Interquartile Range (IQR) | 0.65% | 0.63% |
| Standard Deviation (Sample) | 1.2% | 0.93% |
| Standard Deviation (Population) | 1.2% | 0.92% |
Similar Demographics by Hearing Disability
Demographics Similar to Brazilians by Hearing Disability
In terms of hearing disability, the demographic groups most similar to Brazilians are Tongan (2.9%, a difference of 0.010%), Immigrants from Congo (2.9%, a difference of 0.020%), Immigrants from Bulgaria (2.9%, a difference of 0.070%), Immigrants from Russia (2.9%, a difference of 0.15%), and Immigrants from Panama (2.9%, a difference of 0.26%).
| Demographics | Rating | Rank | Hearing Disability |
| Bermudans | 83.8 /100 | #139 | Excellent 2.9% |
| Immigrants | Jordan | 83.7 /100 | #140 | Excellent 2.9% |
| Sub-Saharan Africans | 83.3 /100 | #141 | Excellent 2.9% |
| Laotians | 81.1 /100 | #142 | Excellent 2.9% |
| Immigrants | Bahamas | 80.9 /100 | #143 | Excellent 2.9% |
| Immigrants | Bulgaria | 79.2 /100 | #144 | Good 2.9% |
| Immigrants | Congo | 78.9 /100 | #145 | Good 2.9% |
| Brazilians | 78.7 /100 | #146 | Good 2.9% |
| Tongans | 78.6 /100 | #147 | Good 2.9% |
| Immigrants | Russia | 77.7 /100 | #148 | Good 2.9% |
| Immigrants | Panama | 76.9 /100 | #149 | Good 2.9% |
| Palestinians | 73.6 /100 | #150 | Good 2.9% |
| Immigrants | France | 73.1 /100 | #151 | Good 2.9% |
| Immigrants | Lithuania | 73.0 /100 | #152 | Good 2.9% |
| Sudanese | 72.1 /100 | #153 | Good 2.9% |
Demographics Similar to Immigrants from Hong Kong by Hearing Disability
In terms of hearing disability, the demographic groups most similar to Immigrants from Hong Kong are Paraguayan (2.7%, a difference of 0.070%), Immigrants from South America (2.7%, a difference of 0.26%), Jamaican (2.7%, a difference of 0.36%), Immigrants from Singapore (2.6%, a difference of 0.38%), and Immigrants from Eastern Asia (2.7%, a difference of 0.42%).
| Demographics | Rating | Rank | Hearing Disability |
| Nigerians | 99.4 /100 | #44 | Exceptional 2.6% |
| Venezuelans | 99.4 /100 | #45 | Exceptional 2.6% |
| Immigrants | Dominica | 99.3 /100 | #46 | Exceptional 2.6% |
| Immigrants | Israel | 99.3 /100 | #47 | Exceptional 2.6% |
| Immigrants | Singapore | 99.3 /100 | #48 | Exceptional 2.6% |
| Immigrants | South America | 99.2 /100 | #49 | Exceptional 2.7% |
| Paraguayans | 99.2 /100 | #50 | Exceptional 2.7% |
| Immigrants | Hong Kong | 99.2 /100 | #51 | Exceptional 2.7% |
| Jamaicans | 99.0 /100 | #52 | Exceptional 2.7% |
| Immigrants | Eastern Asia | 99.0 /100 | #53 | Exceptional 2.7% |
| Ethiopians | 99.0 /100 | #54 | Exceptional 2.7% |
| Immigrants | Ethiopia | 99.0 /100 | #55 | Exceptional 2.7% |
| Immigrants | Nicaragua | 99.0 /100 | #56 | Exceptional 2.7% |
| South Americans | 99.0 /100 | #57 | Exceptional 2.7% |
| Immigrants | Peru | 98.6 /100 | #58 | Exceptional 2.7% |