Creek vs Immigrants from Guyana Ambulatory Disability
COMPARE
Creek
Immigrants from Guyana
Ambulatory Disability
Ambulatory Disability Comparison
Creek
Immigrants from Guyana
8.5%
AMBULATORY DISABILITY
0.0/ 100
METRIC RATING
341st/ 347
METRIC RANK
6.7%
AMBULATORY DISABILITY
0.1/ 100
METRIC RATING
275th/ 347
METRIC RANK
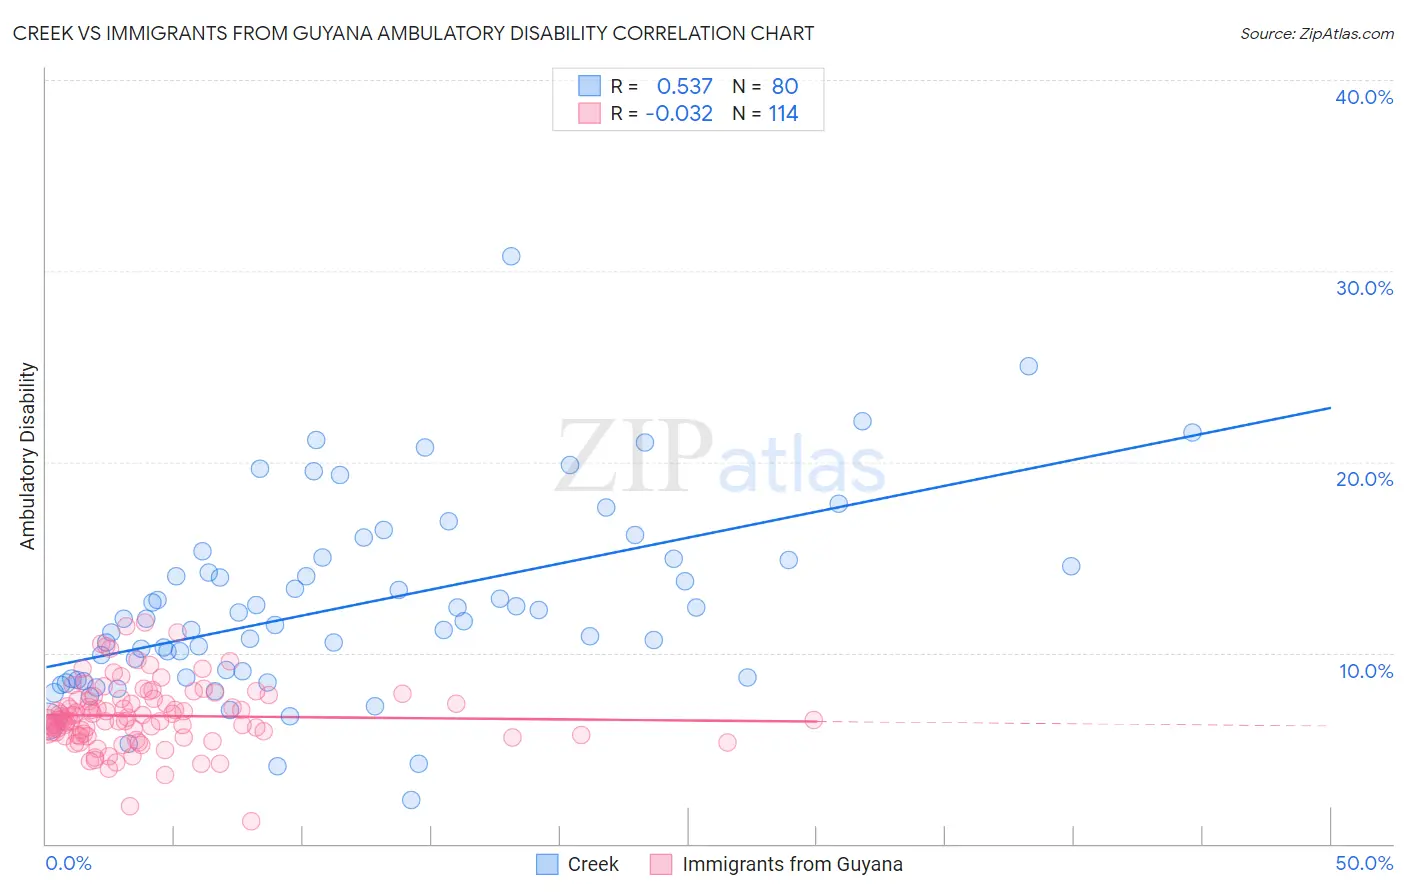
Creek vs Immigrants from Guyana Ambulatory Disability Correlation Chart
The statistical analysis conducted on geographies consisting of 178,444,493 people shows a substantial positive correlation between the proportion of Creek and percentage of population with ambulatory disability in the United States with a correlation coefficient (R) of 0.537 and weighted average of 8.5%. Similarly, the statistical analysis conducted on geographies consisting of 183,703,785 people shows no correlation between the proportion of Immigrants from Guyana and percentage of population with ambulatory disability in the United States with a correlation coefficient (R) of -0.032 and weighted average of 6.7%, a difference of 25.9%.
Ambulatory Disability Correlation Summary
| Measurement | Creek | Immigrants from Guyana |
| Minimum | 2.3% | 1.2% |
| Maximum | 30.8% | 11.6% |
| Range | 28.5% | 10.4% |
| Mean | 12.5% | 6.7% |
| Median | 11.7% | 6.5% |
| Interquartile 25% (IQ1) | 8.7% | 5.7% |
| Interquartile 75% (IQ3) | 14.9% | 7.6% |
| Interquartile Range (IQR) | 6.2% | 1.9% |
| Standard Deviation (Sample) | 5.0% | 1.7% |
| Standard Deviation (Population) | 5.0% | 1.7% |
Similar Demographics by Ambulatory Disability
Demographics Similar to Creek by Ambulatory Disability
In terms of ambulatory disability, the demographic groups most similar to Creek are Choctaw (8.3%, a difference of 1.6%), Kiowa (8.6%, a difference of 1.9%), Pima (8.2%, a difference of 2.5%), Colville (8.2%, a difference of 2.8%), and Tohono O'odham (8.7%, a difference of 3.4%).
| Demographics | Rating | Rank | Ambulatory Disability |
| Cherokee | 0.0 /100 | #333 | Tragic 7.9% |
| Yuman | 0.0 /100 | #334 | Tragic 7.9% |
| Chickasaw | 0.0 /100 | #335 | Tragic 8.0% |
| Seminole | 0.0 /100 | #336 | Tragic 8.0% |
| Dutch West Indians | 0.0 /100 | #337 | Tragic 8.2% |
| Colville | 0.0 /100 | #338 | Tragic 8.2% |
| Pima | 0.0 /100 | #339 | Tragic 8.2% |
| Choctaw | 0.0 /100 | #340 | Tragic 8.3% |
| Creek | 0.0 /100 | #341 | Tragic 8.5% |
| Kiowa | 0.0 /100 | #342 | Tragic 8.6% |
| Tohono O'odham | 0.0 /100 | #343 | Tragic 8.7% |
| Tsimshian | 0.0 /100 | #344 | Tragic 8.8% |
| Puerto Ricans | 0.0 /100 | #345 | Tragic 8.9% |
| Houma | 0.0 /100 | #346 | Tragic 9.3% |
| Lumbee | 0.0 /100 | #347 | Tragic 9.5% |
Demographics Similar to Immigrants from Guyana by Ambulatory Disability
In terms of ambulatory disability, the demographic groups most similar to Immigrants from Guyana are Celtic (6.7%, a difference of 0.030%), Sioux (6.7%, a difference of 0.060%), Jamaican (6.7%, a difference of 0.11%), Immigrants from West Indies (6.7%, a difference of 0.18%), and White/Caucasian (6.7%, a difference of 0.31%).
| Demographics | Rating | Rank | Ambulatory Disability |
| Spanish | 0.2 /100 | #268 | Tragic 6.6% |
| French | 0.1 /100 | #269 | Tragic 6.6% |
| Slovaks | 0.1 /100 | #270 | Tragic 6.7% |
| Immigrants | Trinidad and Tobago | 0.1 /100 | #271 | Tragic 6.7% |
| French Canadians | 0.1 /100 | #272 | Tragic 6.7% |
| Whites/Caucasians | 0.1 /100 | #273 | Tragic 6.7% |
| Sioux | 0.1 /100 | #274 | Tragic 6.7% |
| Immigrants | Guyana | 0.1 /100 | #275 | Tragic 6.7% |
| Celtics | 0.1 /100 | #276 | Tragic 6.7% |
| Jamaicans | 0.1 /100 | #277 | Tragic 6.7% |
| Immigrants | West Indies | 0.1 /100 | #278 | Tragic 6.7% |
| Immigrants | Caribbean | 0.0 /100 | #279 | Tragic 6.7% |
| Pennsylvania Germans | 0.0 /100 | #280 | Tragic 6.8% |
| Yaqui | 0.0 /100 | #281 | Tragic 6.8% |
| Barbadians | 0.0 /100 | #282 | Tragic 6.8% |