Cree vs Immigrants from Switzerland Unemployment
COMPARE
Cree
Immigrants from Switzerland
Unemployment
Unemployment Comparison
Cree
Immigrants from Switzerland
5.6%
UNEMPLOYMENT
2.6/ 100
METRIC RATING
240th/ 347
METRIC RANK
5.1%
UNEMPLOYMENT
89.1/ 100
METRIC RATING
122nd/ 347
METRIC RANK
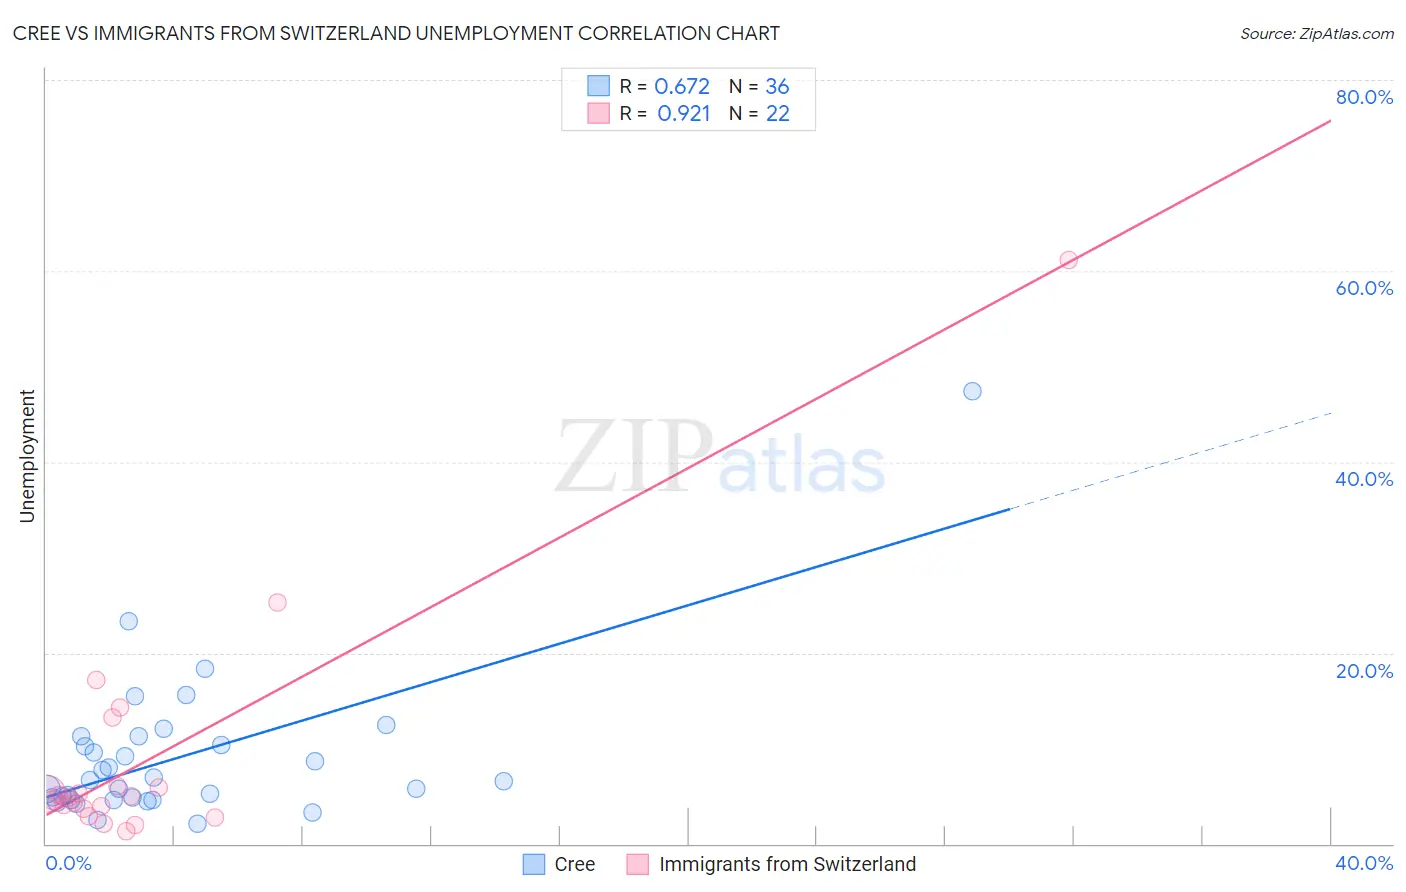
Cree vs Immigrants from Switzerland Unemployment Correlation Chart
The statistical analysis conducted on geographies consisting of 76,166,078 people shows a significant positive correlation between the proportion of Cree and unemployment in the United States with a correlation coefficient (R) of 0.672 and weighted average of 5.6%. Similarly, the statistical analysis conducted on geographies consisting of 148,014,633 people shows a near-perfect positive correlation between the proportion of Immigrants from Switzerland and unemployment in the United States with a correlation coefficient (R) of 0.921 and weighted average of 5.1%, a difference of 9.1%.
Unemployment Correlation Summary
| Measurement | Cree | Immigrants from Switzerland |
| Minimum | 2.1% | 1.3% |
| Maximum | 47.4% | 61.1% |
| Range | 45.3% | 59.8% |
| Mean | 9.1% | 9.1% |
| Median | 6.6% | 4.9% |
| Interquartile 25% (IQ1) | 4.7% | 3.6% |
| Interquartile 75% (IQ3) | 10.8% | 6.0% |
| Interquartile Range (IQR) | 6.1% | 2.4% |
| Standard Deviation (Sample) | 8.0% | 13.0% |
| Standard Deviation (Population) | 7.9% | 12.7% |
Similar Demographics by Unemployment
Demographics Similar to Cree by Unemployment
In terms of unemployment, the demographic groups most similar to Cree are Immigrants (5.5%, a difference of 0.010%), Immigrants from Western Asia (5.5%, a difference of 0.10%), Moroccan (5.5%, a difference of 0.31%), Tlingit-Haida (5.6%, a difference of 0.34%), and Spanish American (5.6%, a difference of 0.35%).
| Demographics | Rating | Rank | Unemployment |
| Immigrants | Syria | 4.8 /100 | #233 | Tragic 5.5% |
| Panamanians | 4.7 /100 | #234 | Tragic 5.5% |
| Immigrants | Panama | 3.4 /100 | #235 | Tragic 5.5% |
| Immigrants | Cambodia | 3.3 /100 | #236 | Tragic 5.5% |
| Moroccans | 3.2 /100 | #237 | Tragic 5.5% |
| Immigrants | Western Asia | 2.8 /100 | #238 | Tragic 5.5% |
| Immigrants | Immigrants | 2.6 /100 | #239 | Tragic 5.5% |
| Cree | 2.6 /100 | #240 | Tragic 5.6% |
| Tlingit-Haida | 2.0 /100 | #241 | Tragic 5.6% |
| Spanish Americans | 2.0 /100 | #242 | Tragic 5.6% |
| Marshallese | 1.3 /100 | #243 | Tragic 5.6% |
| Dutch West Indians | 1.2 /100 | #244 | Tragic 5.6% |
| French American Indians | 1.2 /100 | #245 | Tragic 5.6% |
| Bermudans | 1.1 /100 | #246 | Tragic 5.6% |
| Immigrants | Cameroon | 1.0 /100 | #247 | Tragic 5.6% |
Demographics Similar to Immigrants from Switzerland by Unemployment
In terms of unemployment, the demographic groups most similar to Immigrants from Switzerland are Lebanese (5.1%, a difference of 0.020%), Asian (5.1%, a difference of 0.020%), Ethiopian (5.1%, a difference of 0.080%), Immigrants from France (5.1%, a difference of 0.090%), and Macedonian (5.1%, a difference of 0.090%).
| Demographics | Rating | Rank | Unemployment |
| Immigrants | Western Europe | 91.1 /100 | #115 | Exceptional 5.1% |
| Immigrants | Sri Lanka | 91.1 /100 | #116 | Exceptional 5.1% |
| Immigrants | Malaysia | 91.0 /100 | #117 | Exceptional 5.1% |
| Immigrants | Germany | 90.8 /100 | #118 | Exceptional 5.1% |
| Immigrants | France | 89.7 /100 | #119 | Excellent 5.1% |
| Macedonians | 89.7 /100 | #120 | Excellent 5.1% |
| Lebanese | 89.2 /100 | #121 | Excellent 5.1% |
| Immigrants | Switzerland | 89.1 /100 | #122 | Excellent 5.1% |
| Asians | 89.0 /100 | #123 | Excellent 5.1% |
| Ethiopians | 88.6 /100 | #124 | Excellent 5.1% |
| Immigrants | Eastern Asia | 88.3 /100 | #125 | Excellent 5.1% |
| Kenyans | 88.2 /100 | #126 | Excellent 5.1% |
| Immigrants | Kenya | 88.2 /100 | #127 | Excellent 5.1% |
| Immigrants | Eastern Africa | 88.1 /100 | #128 | Excellent 5.1% |
| Immigrants | Latvia | 88.0 /100 | #129 | Excellent 5.1% |