British West Indian vs Immigrants from Switzerland Vision Disability
COMPARE
British West Indian
Immigrants from Switzerland
Vision Disability
Vision Disability Comparison
British West Indians
Immigrants from Switzerland
2.4%
VISION DISABILITY
0.2/ 100
METRIC RATING
258th/ 347
METRIC RANK
2.0%
VISION DISABILITY
97.0/ 100
METRIC RATING
87th/ 347
METRIC RANK
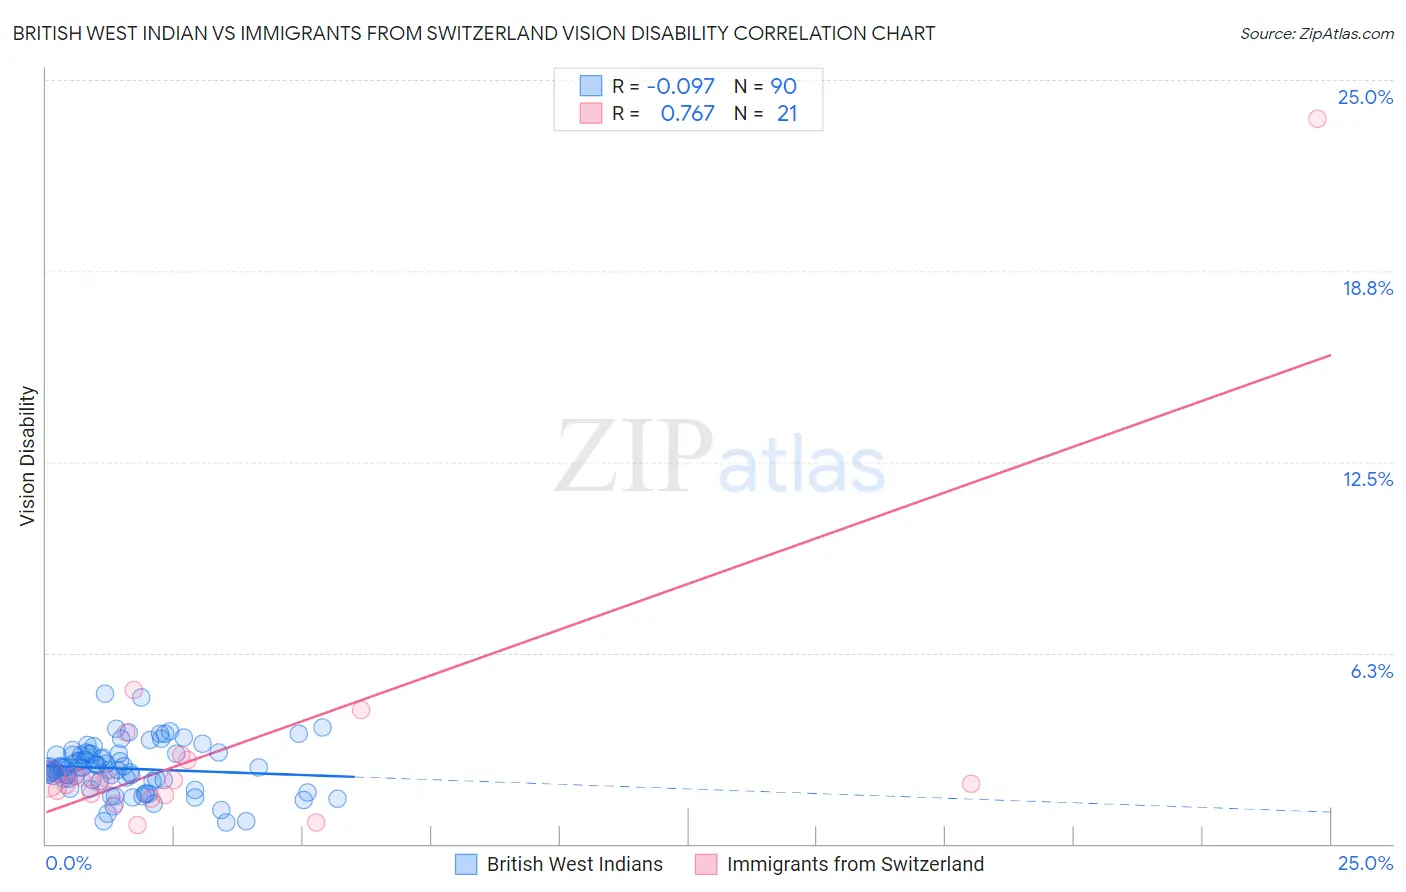
British West Indian vs Immigrants from Switzerland Vision Disability Correlation Chart
The statistical analysis conducted on geographies consisting of 152,656,030 people shows a slight negative correlation between the proportion of British West Indians and percentage of population with vision disability in the United States with a correlation coefficient (R) of -0.097 and weighted average of 2.4%. Similarly, the statistical analysis conducted on geographies consisting of 148,059,339 people shows a strong positive correlation between the proportion of Immigrants from Switzerland and percentage of population with vision disability in the United States with a correlation coefficient (R) of 0.767 and weighted average of 2.0%, a difference of 16.2%.
Vision Disability Correlation Summary
| Measurement | British West Indian | Immigrants from Switzerland |
| Minimum | 0.69% | 0.59% |
| Maximum | 4.9% | 23.7% |
| Range | 4.2% | 23.1% |
| Mean | 2.5% | 3.2% |
| Median | 2.5% | 2.1% |
| Interquartile 25% (IQ1) | 2.1% | 1.6% |
| Interquartile 75% (IQ3) | 2.9% | 2.8% |
| Interquartile Range (IQR) | 0.88% | 1.2% |
| Standard Deviation (Sample) | 0.81% | 4.8% |
| Standard Deviation (Population) | 0.80% | 4.7% |
Similar Demographics by Vision Disability
Demographics Similar to British West Indians by Vision Disability
In terms of vision disability, the demographic groups most similar to British West Indians are White/Caucasian (2.4%, a difference of 0.010%), West Indian (2.4%, a difference of 0.030%), Immigrants from Haiti (2.4%, a difference of 0.10%), Belizean (2.4%, a difference of 0.18%), and Fijian (2.4%, a difference of 0.40%).
| Demographics | Rating | Rank | Vision Disability |
| Immigrants | Laos | 0.4 /100 | #251 | Tragic 2.4% |
| Immigrants | Micronesia | 0.3 /100 | #252 | Tragic 2.4% |
| Japanese | 0.3 /100 | #253 | Tragic 2.4% |
| Haitians | 0.3 /100 | #254 | Tragic 2.4% |
| Immigrants | Guatemala | 0.3 /100 | #255 | Tragic 2.4% |
| Immigrants | Haiti | 0.2 /100 | #256 | Tragic 2.4% |
| West Indians | 0.2 /100 | #257 | Tragic 2.4% |
| British West Indians | 0.2 /100 | #258 | Tragic 2.4% |
| Whites/Caucasians | 0.2 /100 | #259 | Tragic 2.4% |
| Belizeans | 0.2 /100 | #260 | Tragic 2.4% |
| Fijians | 0.1 /100 | #261 | Tragic 2.4% |
| Jamaicans | 0.1 /100 | #262 | Tragic 2.4% |
| Immigrants | Belize | 0.1 /100 | #263 | Tragic 2.4% |
| Immigrants | Liberia | 0.1 /100 | #264 | Tragic 2.4% |
| Immigrants | Jamaica | 0.1 /100 | #265 | Tragic 2.4% |
Demographics Similar to Immigrants from Switzerland by Vision Disability
In terms of vision disability, the demographic groups most similar to Immigrants from Switzerland are Norwegian (2.0%, a difference of 0.010%), Immigrants from Eastern Africa (2.0%, a difference of 0.050%), Immigrants from Moldova (2.0%, a difference of 0.060%), Chinese (2.0%, a difference of 0.090%), and Immigrants from Latvia (2.0%, a difference of 0.14%).
| Demographics | Rating | Rank | Vision Disability |
| Lithuanians | 97.7 /100 | #80 | Exceptional 2.0% |
| Soviet Union | 97.6 /100 | #81 | Exceptional 2.0% |
| Immigrants | Poland | 97.6 /100 | #82 | Exceptional 2.0% |
| Immigrants | Western Asia | 97.5 /100 | #83 | Exceptional 2.0% |
| Immigrants | Latvia | 97.3 /100 | #84 | Exceptional 2.0% |
| Chinese | 97.2 /100 | #85 | Exceptional 2.0% |
| Immigrants | Moldova | 97.2 /100 | #86 | Exceptional 2.0% |
| Immigrants | Switzerland | 97.0 /100 | #87 | Exceptional 2.0% |
| Norwegians | 97.0 /100 | #88 | Exceptional 2.0% |
| Immigrants | Eastern Africa | 97.0 /100 | #89 | Exceptional 2.0% |
| Immigrants | Lebanon | 96.7 /100 | #90 | Exceptional 2.1% |
| Immigrants | Somalia | 96.2 /100 | #91 | Exceptional 2.1% |
| Immigrants | Syria | 96.2 /100 | #92 | Exceptional 2.1% |
| Immigrants | Europe | 96.1 /100 | #93 | Exceptional 2.1% |
| Immigrants | Croatia | 96.0 /100 | #94 | Exceptional 2.1% |