Cambodian vs Immigrants from Switzerland Vision Disability
COMPARE
Cambodian
Immigrants from Switzerland
Vision Disability
Vision Disability Comparison
Cambodians
Immigrants from Switzerland
2.0%
VISION DISABILITY
99.8/ 100
METRIC RATING
36th/ 347
METRIC RANK
2.0%
VISION DISABILITY
97.0/ 100
METRIC RATING
87th/ 347
METRIC RANK
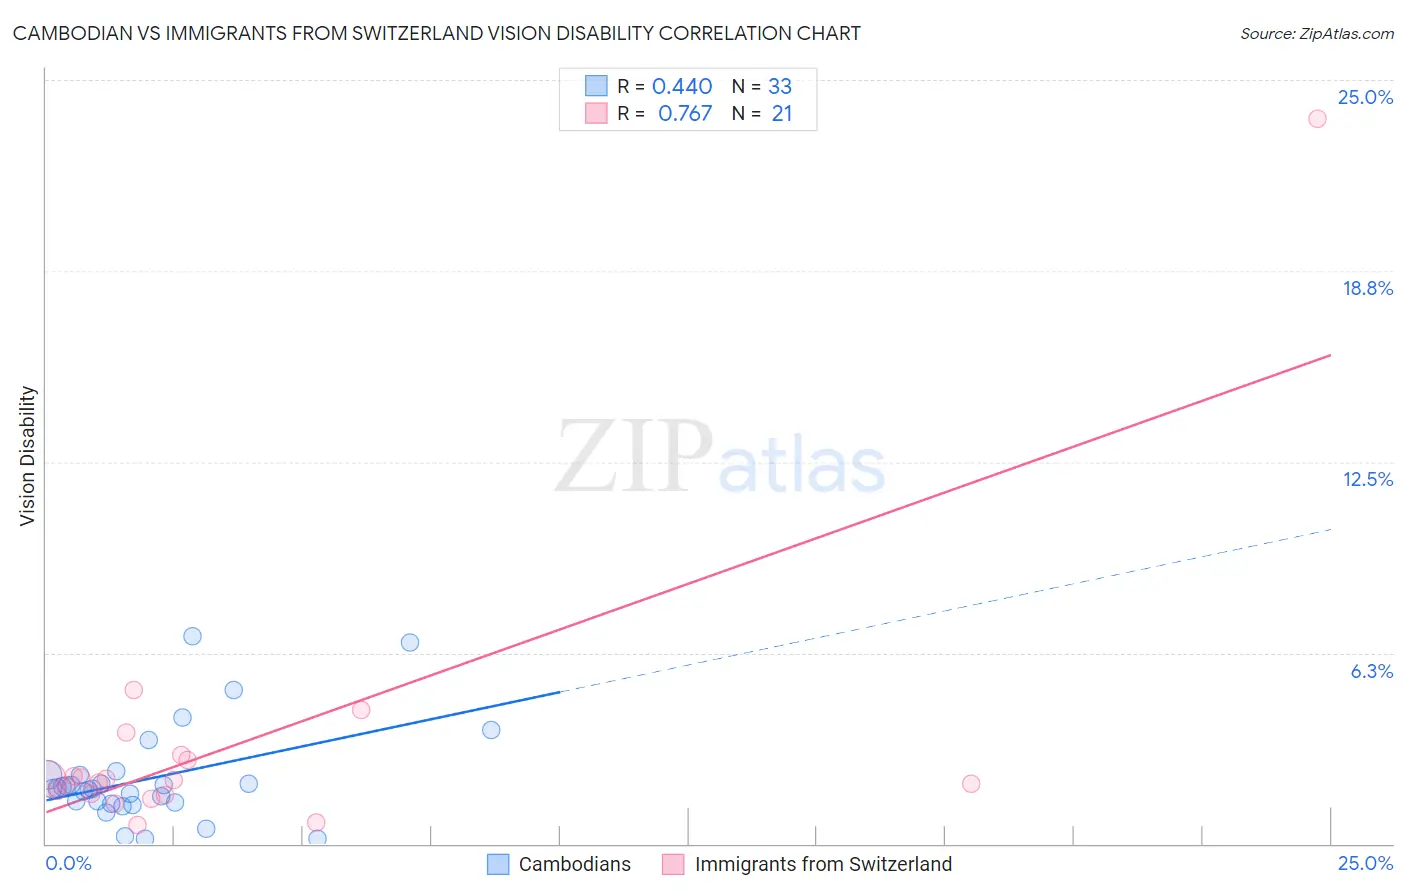
Cambodian vs Immigrants from Switzerland Vision Disability Correlation Chart
The statistical analysis conducted on geographies consisting of 102,480,500 people shows a moderate positive correlation between the proportion of Cambodians and percentage of population with vision disability in the United States with a correlation coefficient (R) of 0.440 and weighted average of 2.0%. Similarly, the statistical analysis conducted on geographies consisting of 148,059,339 people shows a strong positive correlation between the proportion of Immigrants from Switzerland and percentage of population with vision disability in the United States with a correlation coefficient (R) of 0.767 and weighted average of 2.0%, a difference of 4.7%.
Vision Disability Correlation Summary
| Measurement | Cambodian | Immigrants from Switzerland |
| Minimum | 0.17% | 0.59% |
| Maximum | 6.8% | 23.7% |
| Range | 6.6% | 23.1% |
| Mean | 2.1% | 3.2% |
| Median | 1.8% | 2.1% |
| Interquartile 25% (IQ1) | 1.3% | 1.6% |
| Interquartile 75% (IQ3) | 2.2% | 2.8% |
| Interquartile Range (IQR) | 0.90% | 1.2% |
| Standard Deviation (Sample) | 1.6% | 4.8% |
| Standard Deviation (Population) | 1.5% | 4.7% |
Similar Demographics by Vision Disability
Demographics Similar to Cambodians by Vision Disability
In terms of vision disability, the demographic groups most similar to Cambodians are Bhutanese (2.0%, a difference of 0.25%), Immigrants from Kuwait (2.0%, a difference of 0.29%), Zimbabwean (2.0%, a difference of 0.34%), Immigrants from Australia (1.9%, a difference of 0.35%), and Immigrants from Turkey (1.9%, a difference of 0.44%).
| Demographics | Rating | Rank | Vision Disability |
| Egyptians | 99.9 /100 | #29 | Exceptional 1.9% |
| Immigrants | Nepal | 99.9 /100 | #30 | Exceptional 1.9% |
| Mongolians | 99.9 /100 | #31 | Exceptional 1.9% |
| Luxembourgers | 99.9 /100 | #32 | Exceptional 1.9% |
| Immigrants | Egypt | 99.9 /100 | #33 | Exceptional 1.9% |
| Immigrants | Turkey | 99.8 /100 | #34 | Exceptional 1.9% |
| Immigrants | Australia | 99.8 /100 | #35 | Exceptional 1.9% |
| Cambodians | 99.8 /100 | #36 | Exceptional 2.0% |
| Bhutanese | 99.8 /100 | #37 | Exceptional 2.0% |
| Immigrants | Kuwait | 99.8 /100 | #38 | Exceptional 2.0% |
| Zimbabweans | 99.7 /100 | #39 | Exceptional 2.0% |
| Immigrants | Ireland | 99.7 /100 | #40 | Exceptional 2.0% |
| Cypriots | 99.7 /100 | #41 | Exceptional 2.0% |
| Immigrants | Ethiopia | 99.7 /100 | #42 | Exceptional 2.0% |
| Eastern Europeans | 99.7 /100 | #43 | Exceptional 2.0% |
Demographics Similar to Immigrants from Switzerland by Vision Disability
In terms of vision disability, the demographic groups most similar to Immigrants from Switzerland are Norwegian (2.0%, a difference of 0.010%), Immigrants from Eastern Africa (2.0%, a difference of 0.050%), Immigrants from Moldova (2.0%, a difference of 0.060%), Chinese (2.0%, a difference of 0.090%), and Immigrants from Latvia (2.0%, a difference of 0.14%).
| Demographics | Rating | Rank | Vision Disability |
| Lithuanians | 97.7 /100 | #80 | Exceptional 2.0% |
| Soviet Union | 97.6 /100 | #81 | Exceptional 2.0% |
| Immigrants | Poland | 97.6 /100 | #82 | Exceptional 2.0% |
| Immigrants | Western Asia | 97.5 /100 | #83 | Exceptional 2.0% |
| Immigrants | Latvia | 97.3 /100 | #84 | Exceptional 2.0% |
| Chinese | 97.2 /100 | #85 | Exceptional 2.0% |
| Immigrants | Moldova | 97.2 /100 | #86 | Exceptional 2.0% |
| Immigrants | Switzerland | 97.0 /100 | #87 | Exceptional 2.0% |
| Norwegians | 97.0 /100 | #88 | Exceptional 2.0% |
| Immigrants | Eastern Africa | 97.0 /100 | #89 | Exceptional 2.0% |
| Immigrants | Lebanon | 96.7 /100 | #90 | Exceptional 2.1% |
| Immigrants | Somalia | 96.2 /100 | #91 | Exceptional 2.1% |
| Immigrants | Syria | 96.2 /100 | #92 | Exceptional 2.1% |
| Immigrants | Europe | 96.1 /100 | #93 | Exceptional 2.1% |
| Immigrants | Croatia | 96.0 /100 | #94 | Exceptional 2.1% |