Indonesian vs Immigrants from Latvia Hearing Disability
COMPARE
Indonesian
Immigrants from Latvia
Hearing Disability
Hearing Disability Comparison
Indonesians
Immigrants from Latvia
3.0%
HEARING DISABILITY
50.0/ 100
METRIC RATING
174th/ 347
METRIC RANK
3.1%
HEARING DISABILITY
12.7/ 100
METRIC RATING
208th/ 347
METRIC RANK
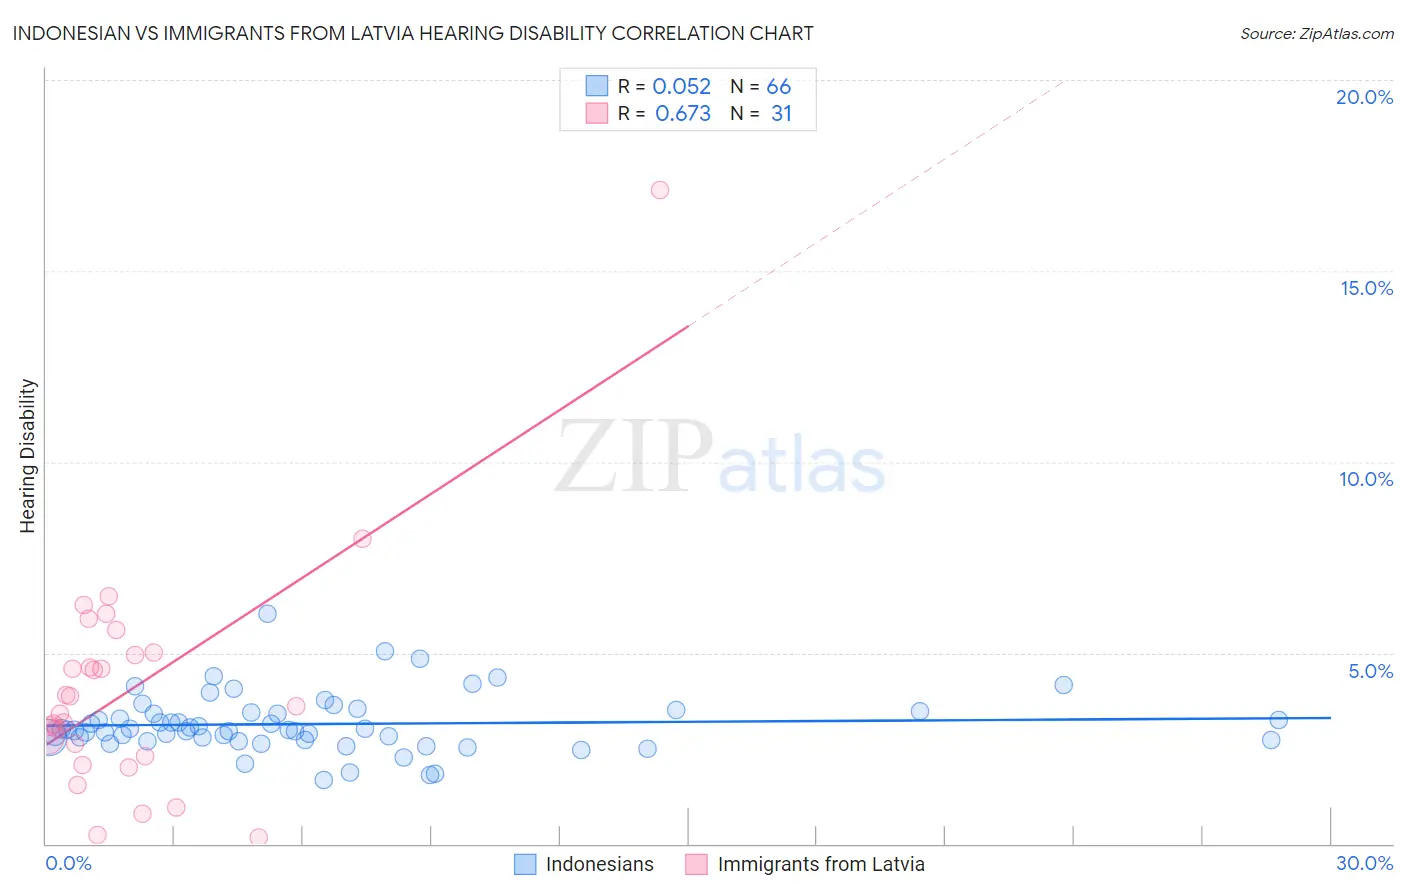
Indonesian vs Immigrants from Latvia Hearing Disability Correlation Chart
The statistical analysis conducted on geographies consisting of 162,712,872 people shows a slight positive correlation between the proportion of Indonesians and percentage of population with hearing disability in the United States with a correlation coefficient (R) of 0.052 and weighted average of 3.0%. Similarly, the statistical analysis conducted on geographies consisting of 113,736,493 people shows a significant positive correlation between the proportion of Immigrants from Latvia and percentage of population with hearing disability in the United States with a correlation coefficient (R) of 0.673 and weighted average of 3.1%, a difference of 4.5%.
Hearing Disability Correlation Summary
| Measurement | Indonesian | Immigrants from Latvia |
| Minimum | 1.7% | 0.16% |
| Maximum | 6.0% | 17.1% |
| Range | 4.3% | 17.0% |
| Mean | 3.1% | 4.1% |
| Median | 3.0% | 3.6% |
| Interquartile 25% (IQ1) | 2.7% | 2.3% |
| Interquartile 75% (IQ3) | 3.5% | 5.0% |
| Interquartile Range (IQR) | 0.72% | 2.7% |
| Standard Deviation (Sample) | 0.76% | 3.1% |
| Standard Deviation (Population) | 0.76% | 3.0% |
Similar Demographics by Hearing Disability
Demographics Similar to Indonesians by Hearing Disability
In terms of hearing disability, the demographic groups most similar to Indonesians are Immigrants from Serbia (3.0%, a difference of 0.10%), Immigrants from Romania (3.0%, a difference of 0.15%), Panamanian (3.0%, a difference of 0.28%), Immigrants from Philippines (3.0%, a difference of 0.34%), and Japanese (3.0%, a difference of 0.38%).
| Demographics | Rating | Rank | Hearing Disability |
| Immigrants | Eastern Europe | 58.1 /100 | #167 | Average 3.0% |
| Immigrants | Greece | 57.9 /100 | #168 | Average 3.0% |
| Arabs | 57.6 /100 | #169 | Average 3.0% |
| Immigrants | Cabo Verde | 56.9 /100 | #170 | Average 3.0% |
| Immigrants | Ukraine | 56.6 /100 | #171 | Average 3.0% |
| Armenians | 56.0 /100 | #172 | Average 3.0% |
| Immigrants | Serbia | 51.1 /100 | #173 | Average 3.0% |
| Indonesians | 50.0 /100 | #174 | Average 3.0% |
| Immigrants | Romania | 48.4 /100 | #175 | Average 3.0% |
| Panamanians | 47.0 /100 | #176 | Average 3.0% |
| Immigrants | Philippines | 46.4 /100 | #177 | Average 3.0% |
| Japanese | 46.0 /100 | #178 | Average 3.0% |
| Immigrants | Moldova | 43.1 /100 | #179 | Average 3.0% |
| Immigrants | Sweden | 42.4 /100 | #180 | Average 3.0% |
| Immigrants | Belgium | 41.5 /100 | #181 | Average 3.0% |
Demographics Similar to Immigrants from Latvia by Hearing Disability
In terms of hearing disability, the demographic groups most similar to Immigrants from Latvia are Immigrants from Hungary (3.1%, a difference of 0.040%), Cape Verdean (3.1%, a difference of 0.090%), Romanian (3.1%, a difference of 0.13%), Pakistani (3.1%, a difference of 0.33%), and Hispanic or Latino (3.1%, a difference of 0.46%).
| Demographics | Rating | Rank | Hearing Disability |
| Iraqis | 19.0 /100 | #201 | Poor 3.1% |
| Immigrants | Thailand | 16.4 /100 | #202 | Poor 3.1% |
| Immigrants | Denmark | 16.2 /100 | #203 | Poor 3.1% |
| Immigrants | Czechoslovakia | 15.9 /100 | #204 | Poor 3.1% |
| Alsatians | 15.9 /100 | #205 | Poor 3.1% |
| Eastern Europeans | 15.5 /100 | #206 | Poor 3.1% |
| Hispanics or Latinos | 15.1 /100 | #207 | Poor 3.1% |
| Immigrants | Latvia | 12.7 /100 | #208 | Poor 3.1% |
| Immigrants | Hungary | 12.5 /100 | #209 | Poor 3.1% |
| Cape Verdeans | 12.2 /100 | #210 | Poor 3.1% |
| Romanians | 12.1 /100 | #211 | Poor 3.1% |
| Pakistanis | 11.1 /100 | #212 | Poor 3.1% |
| Immigrants | Iraq | 10.5 /100 | #213 | Poor 3.1% |
| Australians | 8.1 /100 | #214 | Tragic 3.2% |
| Bangladeshis | 8.1 /100 | #215 | Tragic 3.2% |