Slovene vs Immigrants from Latvia Hearing Disability
COMPARE
Slovene
Immigrants from Latvia
Hearing Disability
Hearing Disability Comparison
Slovenes
Immigrants from Latvia
3.5%
HEARING DISABILITY
0.1/ 100
METRIC RATING
259th/ 347
METRIC RANK
3.1%
HEARING DISABILITY
12.7/ 100
METRIC RATING
208th/ 347
METRIC RANK
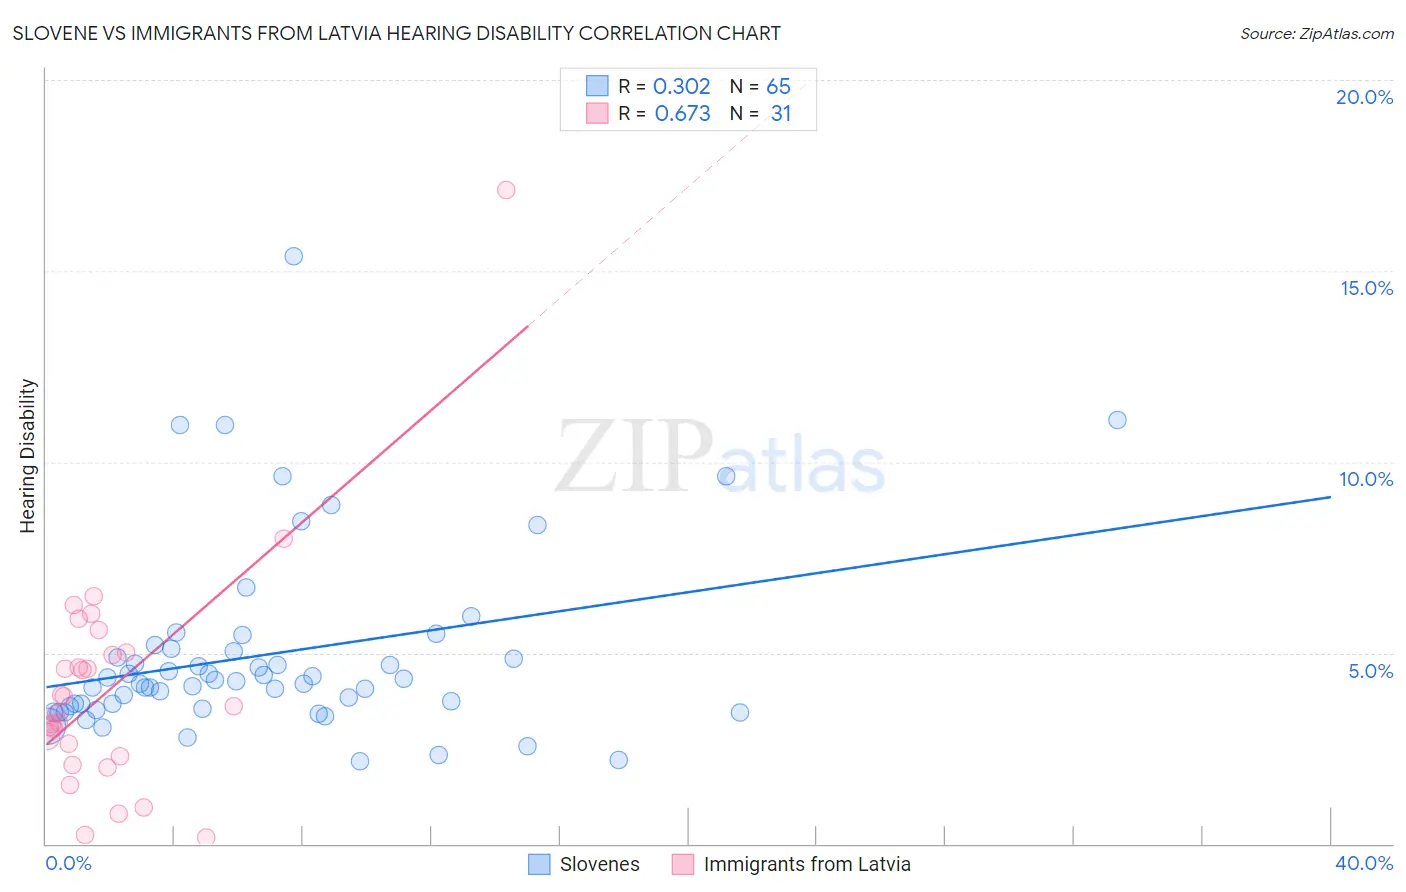
Slovene vs Immigrants from Latvia Hearing Disability Correlation Chart
The statistical analysis conducted on geographies consisting of 261,288,798 people shows a mild positive correlation between the proportion of Slovenes and percentage of population with hearing disability in the United States with a correlation coefficient (R) of 0.302 and weighted average of 3.5%. Similarly, the statistical analysis conducted on geographies consisting of 113,736,493 people shows a significant positive correlation between the proportion of Immigrants from Latvia and percentage of population with hearing disability in the United States with a correlation coefficient (R) of 0.673 and weighted average of 3.1%, a difference of 10.4%.
Hearing Disability Correlation Summary
| Measurement | Slovene | Immigrants from Latvia |
| Minimum | 2.2% | 0.16% |
| Maximum | 15.4% | 17.1% |
| Range | 13.2% | 17.0% |
| Mean | 5.0% | 4.1% |
| Median | 4.3% | 3.6% |
| Interquartile 25% (IQ1) | 3.6% | 2.3% |
| Interquartile 75% (IQ3) | 5.1% | 5.0% |
| Interquartile Range (IQR) | 1.5% | 2.7% |
| Standard Deviation (Sample) | 2.5% | 3.1% |
| Standard Deviation (Population) | 2.4% | 3.0% |
Similar Demographics by Hearing Disability
Demographics Similar to Slovenes by Hearing Disability
In terms of hearing disability, the demographic groups most similar to Slovenes are Portuguese (3.5%, a difference of 0.080%), Hawaiian (3.5%, a difference of 0.11%), Immigrants from North America (3.5%, a difference of 0.23%), Northern European (3.4%, a difference of 0.24%), and Immigrants from Canada (3.5%, a difference of 0.27%).
| Demographics | Rating | Rank | Hearing Disability |
| Croatians | 0.4 /100 | #252 | Tragic 3.4% |
| Carpatho Rusyns | 0.3 /100 | #253 | Tragic 3.4% |
| Slavs | 0.2 /100 | #254 | Tragic 3.4% |
| Poles | 0.2 /100 | #255 | Tragic 3.4% |
| Hmong | 0.2 /100 | #256 | Tragic 3.4% |
| Yaqui | 0.2 /100 | #257 | Tragic 3.4% |
| Northern Europeans | 0.2 /100 | #258 | Tragic 3.4% |
| Slovenes | 0.1 /100 | #259 | Tragic 3.5% |
| Portuguese | 0.1 /100 | #260 | Tragic 3.5% |
| Hawaiians | 0.1 /100 | #261 | Tragic 3.5% |
| Immigrants | North America | 0.1 /100 | #262 | Tragic 3.5% |
| Immigrants | Canada | 0.1 /100 | #263 | Tragic 3.5% |
| Immigrants | Germany | 0.1 /100 | #264 | Tragic 3.5% |
| British | 0.1 /100 | #265 | Tragic 3.5% |
| Belgians | 0.1 /100 | #266 | Tragic 3.5% |
Demographics Similar to Immigrants from Latvia by Hearing Disability
In terms of hearing disability, the demographic groups most similar to Immigrants from Latvia are Immigrants from Hungary (3.1%, a difference of 0.040%), Cape Verdean (3.1%, a difference of 0.090%), Romanian (3.1%, a difference of 0.13%), Pakistani (3.1%, a difference of 0.33%), and Hispanic or Latino (3.1%, a difference of 0.46%).
| Demographics | Rating | Rank | Hearing Disability |
| Iraqis | 19.0 /100 | #201 | Poor 3.1% |
| Immigrants | Thailand | 16.4 /100 | #202 | Poor 3.1% |
| Immigrants | Denmark | 16.2 /100 | #203 | Poor 3.1% |
| Immigrants | Czechoslovakia | 15.9 /100 | #204 | Poor 3.1% |
| Alsatians | 15.9 /100 | #205 | Poor 3.1% |
| Eastern Europeans | 15.5 /100 | #206 | Poor 3.1% |
| Hispanics or Latinos | 15.1 /100 | #207 | Poor 3.1% |
| Immigrants | Latvia | 12.7 /100 | #208 | Poor 3.1% |
| Immigrants | Hungary | 12.5 /100 | #209 | Poor 3.1% |
| Cape Verdeans | 12.2 /100 | #210 | Poor 3.1% |
| Romanians | 12.1 /100 | #211 | Poor 3.1% |
| Pakistanis | 11.1 /100 | #212 | Poor 3.1% |
| Immigrants | Iraq | 10.5 /100 | #213 | Poor 3.1% |
| Australians | 8.1 /100 | #214 | Tragic 3.2% |
| Bangladeshis | 8.1 /100 | #215 | Tragic 3.2% |