Costa Rican vs Iraqi Hearing Disability
COMPARE
Costa Rican
Iraqi
Hearing Disability
Hearing Disability Comparison
Costa Ricans
Iraqis
2.9%
HEARING DISABILITY
71.4/ 100
METRIC RATING
155th/ 347
METRIC RANK
3.1%
HEARING DISABILITY
19.0/ 100
METRIC RATING
201st/ 347
METRIC RANK
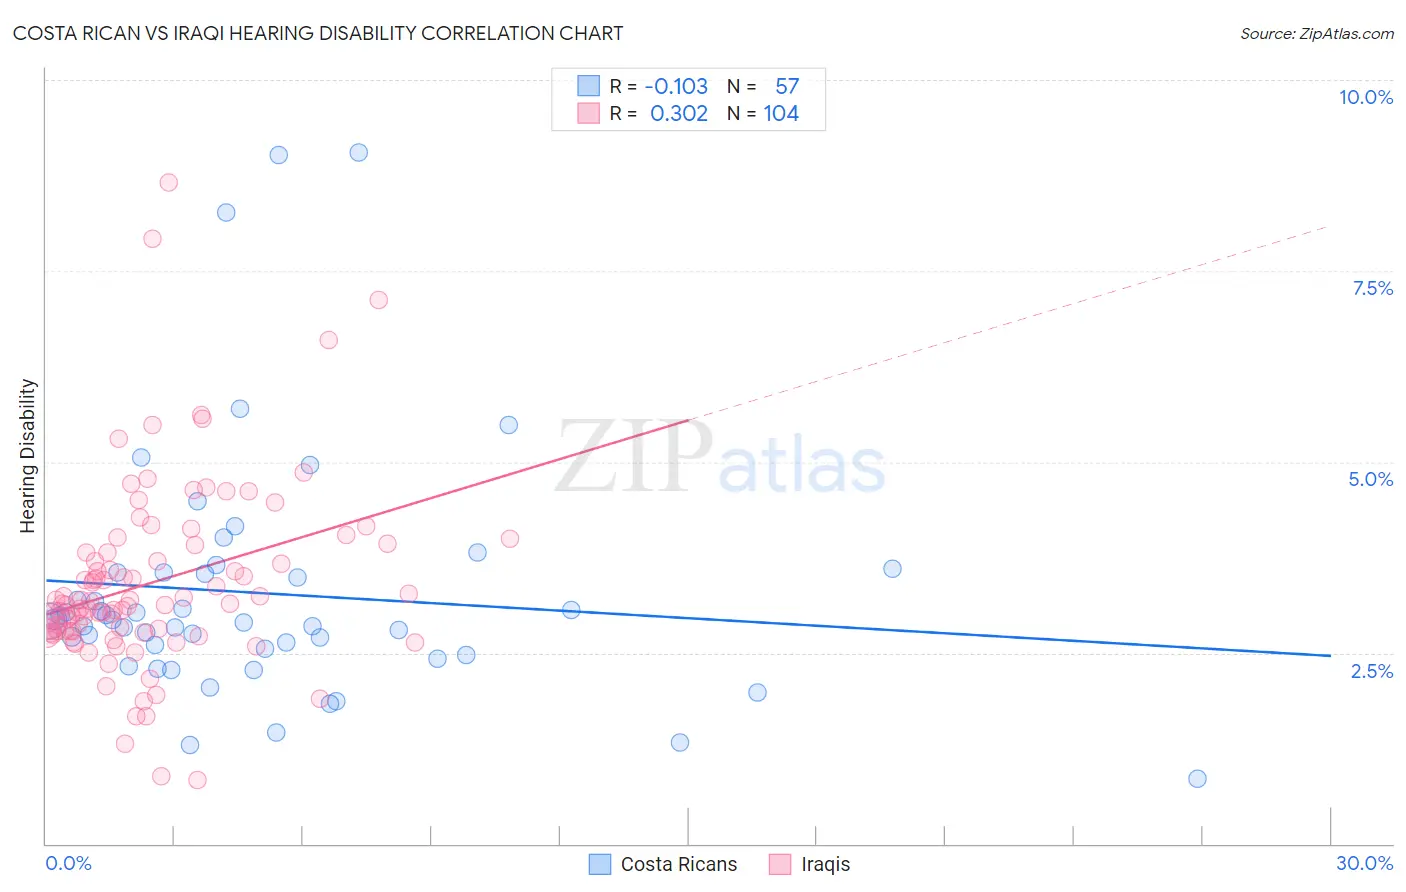
Costa Rican vs Iraqi Hearing Disability Correlation Chart
The statistical analysis conducted on geographies consisting of 253,538,538 people shows a poor negative correlation between the proportion of Costa Ricans and percentage of population with hearing disability in the United States with a correlation coefficient (R) of -0.103 and weighted average of 2.9%. Similarly, the statistical analysis conducted on geographies consisting of 170,639,688 people shows a mild positive correlation between the proportion of Iraqis and percentage of population with hearing disability in the United States with a correlation coefficient (R) of 0.302 and weighted average of 3.1%, a difference of 5.7%.
Hearing Disability Correlation Summary
| Measurement | Costa Rican | Iraqi |
| Minimum | 0.86% | 0.83% |
| Maximum | 9.0% | 8.7% |
| Range | 8.2% | 7.8% |
| Mean | 3.3% | 3.4% |
| Median | 2.9% | 3.1% |
| Interquartile 25% (IQ1) | 2.5% | 2.8% |
| Interquartile 75% (IQ3) | 3.6% | 3.9% |
| Interquartile Range (IQR) | 1.0% | 1.1% |
| Standard Deviation (Sample) | 1.6% | 1.2% |
| Standard Deviation (Population) | 1.6% | 1.2% |
Similar Demographics by Hearing Disability
Demographics Similar to Costa Ricans by Hearing Disability
In terms of hearing disability, the demographic groups most similar to Costa Ricans are Immigrants from Lebanon (2.9%, a difference of 0.010%), Sudanese (2.9%, a difference of 0.090%), Immigrants from Poland (2.9%, a difference of 0.14%), Immigrants from Lithuania (2.9%, a difference of 0.19%), and Immigrants from France (2.9%, a difference of 0.21%).
| Demographics | Rating | Rank | Hearing Disability |
| Immigrants | Russia | 77.7 /100 | #148 | Good 2.9% |
| Immigrants | Panama | 76.9 /100 | #149 | Good 2.9% |
| Palestinians | 73.6 /100 | #150 | Good 2.9% |
| Immigrants | France | 73.1 /100 | #151 | Good 2.9% |
| Immigrants | Lithuania | 73.0 /100 | #152 | Good 2.9% |
| Sudanese | 72.1 /100 | #153 | Good 2.9% |
| Immigrants | Lebanon | 71.5 /100 | #154 | Good 2.9% |
| Costa Ricans | 71.4 /100 | #155 | Good 2.9% |
| Immigrants | Poland | 70.2 /100 | #156 | Good 2.9% |
| Immigrants | Kazakhstan | 69.6 /100 | #157 | Good 2.9% |
| Immigrants | Burma/Myanmar | 69.5 /100 | #158 | Good 2.9% |
| Immigrants | Australia | 67.4 /100 | #159 | Good 2.9% |
| Immigrants | Fiji | 67.1 /100 | #160 | Good 2.9% |
| Albanians | 66.6 /100 | #161 | Good 2.9% |
| Immigrants | Japan | 66.3 /100 | #162 | Good 2.9% |
Demographics Similar to Iraqis by Hearing Disability
In terms of hearing disability, the demographic groups most similar to Iraqis are Immigrants from North Macedonia (3.1%, a difference of 0.020%), Syrian (3.1%, a difference of 0.030%), Immigrants from Croatia (3.1%, a difference of 0.22%), Immigrants from Bosnia and Herzegovina (3.1%, a difference of 0.24%), and Immigrants from Thailand (3.1%, a difference of 0.40%).
| Demographics | Rating | Rank | Hearing Disability |
| South Africans | 24.5 /100 | #194 | Fair 3.1% |
| Spanish American Indians | 24.1 /100 | #195 | Fair 3.1% |
| Immigrants | Europe | 22.9 /100 | #196 | Fair 3.1% |
| Immigrants | Bosnia and Herzegovina | 20.6 /100 | #197 | Fair 3.1% |
| Immigrants | Croatia | 20.5 /100 | #198 | Fair 3.1% |
| Syrians | 19.2 /100 | #199 | Poor 3.1% |
| Immigrants | North Macedonia | 19.1 /100 | #200 | Poor 3.1% |
| Iraqis | 19.0 /100 | #201 | Poor 3.1% |
| Immigrants | Thailand | 16.4 /100 | #202 | Poor 3.1% |
| Immigrants | Denmark | 16.2 /100 | #203 | Poor 3.1% |
| Immigrants | Czechoslovakia | 15.9 /100 | #204 | Poor 3.1% |
| Alsatians | 15.9 /100 | #205 | Poor 3.1% |
| Eastern Europeans | 15.5 /100 | #206 | Poor 3.1% |
| Hispanics or Latinos | 15.1 /100 | #207 | Poor 3.1% |
| Immigrants | Latvia | 12.7 /100 | #208 | Poor 3.1% |