Costa Rican vs Immigrants from Vietnam Ambulatory Disability
COMPARE
Costa Rican
Immigrants from Vietnam
Ambulatory Disability
Ambulatory Disability Comparison
Costa Ricans
Immigrants from Vietnam
5.9%
AMBULATORY DISABILITY
92.6/ 100
METRIC RATING
121st/ 347
METRIC RANK
5.7%
AMBULATORY DISABILITY
99.3/ 100
METRIC RATING
77th/ 347
METRIC RANK
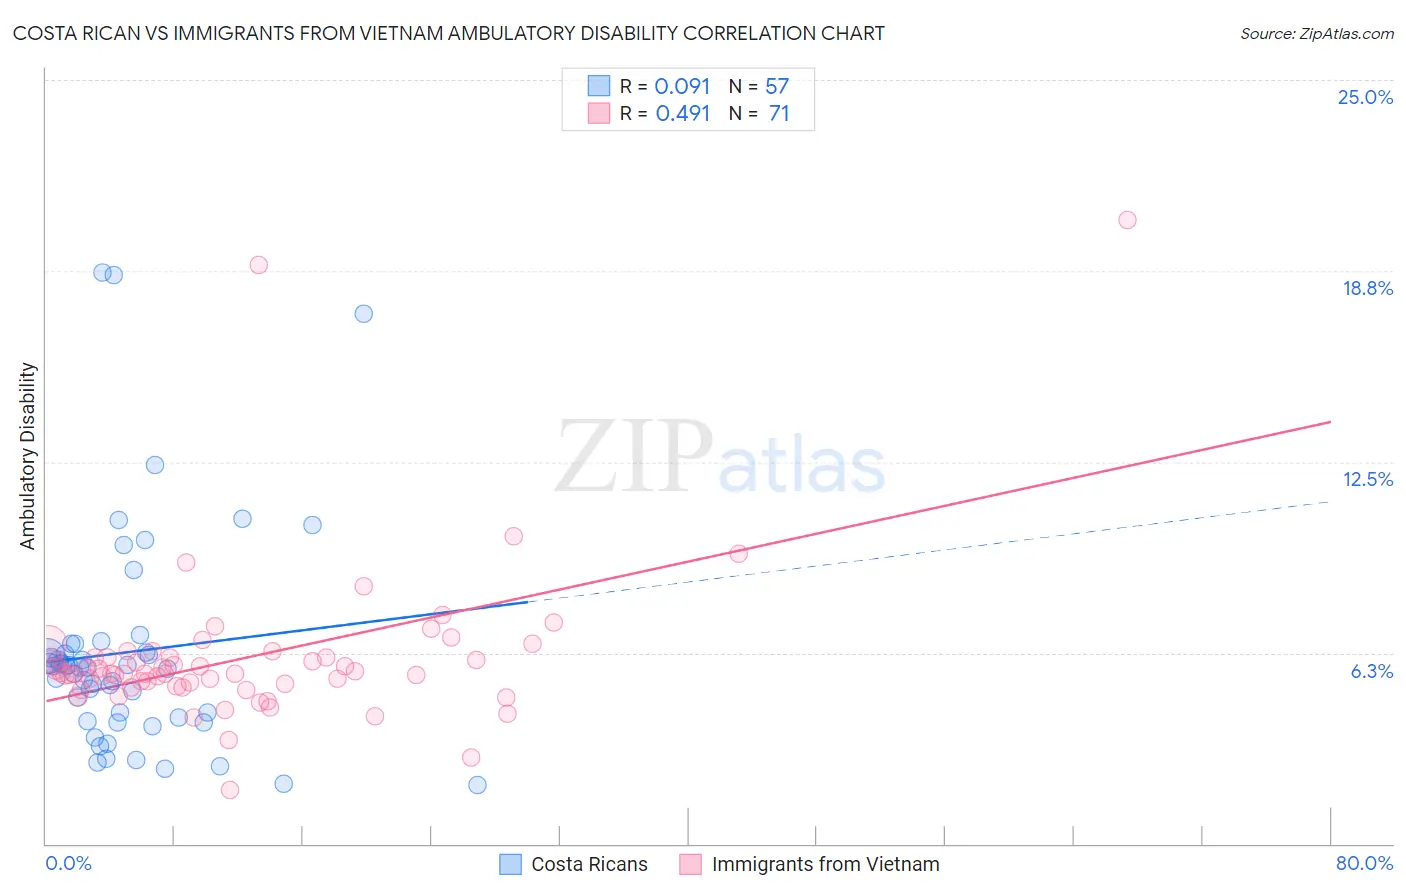
Costa Rican vs Immigrants from Vietnam Ambulatory Disability Correlation Chart
The statistical analysis conducted on geographies consisting of 253,560,556 people shows a slight positive correlation between the proportion of Costa Ricans and percentage of population with ambulatory disability in the United States with a correlation coefficient (R) of 0.091 and weighted average of 5.9%. Similarly, the statistical analysis conducted on geographies consisting of 404,718,209 people shows a moderate positive correlation between the proportion of Immigrants from Vietnam and percentage of population with ambulatory disability in the United States with a correlation coefficient (R) of 0.491 and weighted average of 5.7%, a difference of 3.4%.
Ambulatory Disability Correlation Summary
| Measurement | Costa Rican | Immigrants from Vietnam |
| Minimum | 1.9% | 1.8% |
| Maximum | 18.7% | 20.4% |
| Range | 16.8% | 18.7% |
| Mean | 6.3% | 6.1% |
| Median | 5.8% | 5.6% |
| Interquartile 25% (IQ1) | 4.1% | 5.2% |
| Interquartile 75% (IQ3) | 6.4% | 6.1% |
| Interquartile Range (IQR) | 2.3% | 0.95% |
| Standard Deviation (Sample) | 3.6% | 2.7% |
| Standard Deviation (Population) | 3.6% | 2.6% |
Similar Demographics by Ambulatory Disability
Demographics Similar to Costa Ricans by Ambulatory Disability
In terms of ambulatory disability, the demographic groups most similar to Costa Ricans are Icelander (5.9%, a difference of 0.0%), Immigrants from Russia (5.9%, a difference of 0.020%), Immigrants from Middle Africa (5.9%, a difference of 0.060%), Estonian (5.9%, a difference of 0.070%), and Norwegian (5.9%, a difference of 0.11%).
| Demographics | Rating | Rank | Ambulatory Disability |
| Immigrants | Poland | 95.4 /100 | #114 | Exceptional 5.9% |
| South American Indians | 94.8 /100 | #115 | Exceptional 5.9% |
| Immigrants | Africa | 94.7 /100 | #116 | Exceptional 5.9% |
| Immigrants | South Eastern Asia | 93.6 /100 | #117 | Exceptional 5.9% |
| Russians | 93.4 /100 | #118 | Exceptional 5.9% |
| Norwegians | 93.1 /100 | #119 | Exceptional 5.9% |
| Estonians | 92.9 /100 | #120 | Exceptional 5.9% |
| Costa Ricans | 92.6 /100 | #121 | Exceptional 5.9% |
| Icelanders | 92.6 /100 | #122 | Exceptional 5.9% |
| Immigrants | Russia | 92.4 /100 | #123 | Exceptional 5.9% |
| Immigrants | Middle Africa | 92.2 /100 | #124 | Exceptional 5.9% |
| Koreans | 91.6 /100 | #125 | Exceptional 5.9% |
| Arabs | 91.5 /100 | #126 | Exceptional 5.9% |
| Immigrants | Nigeria | 90.9 /100 | #127 | Exceptional 5.9% |
| Immigrants | Western Asia | 90.7 /100 | #128 | Exceptional 5.9% |
Demographics Similar to Immigrants from Vietnam by Ambulatory Disability
In terms of ambulatory disability, the demographic groups most similar to Immigrants from Vietnam are Somali (5.7%, a difference of 0.010%), Chilean (5.7%, a difference of 0.020%), Immigrants from Ireland (5.7%, a difference of 0.15%), Immigrants from Jordan (5.7%, a difference of 0.16%), and Palestinian (5.7%, a difference of 0.16%).
| Demographics | Rating | Rank | Ambulatory Disability |
| Sierra Leoneans | 99.4 /100 | #70 | Exceptional 5.7% |
| Immigrants | Peru | 99.4 /100 | #71 | Exceptional 5.7% |
| Brazilians | 99.4 /100 | #72 | Exceptional 5.7% |
| Immigrants | Northern Africa | 99.4 /100 | #73 | Exceptional 5.7% |
| Immigrants | Cameroon | 99.4 /100 | #74 | Exceptional 5.7% |
| Immigrants | South Africa | 99.3 /100 | #75 | Exceptional 5.7% |
| Sudanese | 99.3 /100 | #76 | Exceptional 5.7% |
| Immigrants | Vietnam | 99.3 /100 | #77 | Exceptional 5.7% |
| Somalis | 99.2 /100 | #78 | Exceptional 5.7% |
| Chileans | 99.2 /100 | #79 | Exceptional 5.7% |
| Immigrants | Ireland | 99.2 /100 | #80 | Exceptional 5.7% |
| Immigrants | Jordan | 99.2 /100 | #81 | Exceptional 5.7% |
| Palestinians | 99.2 /100 | #82 | Exceptional 5.7% |
| Eastern Europeans | 99.2 /100 | #83 | Exceptional 5.7% |
| Ugandans | 99.2 /100 | #84 | Exceptional 5.7% |