Costa Rican vs Portuguese Ambulatory Disability
COMPARE
Costa Rican
Portuguese
Ambulatory Disability
Ambulatory Disability Comparison
Costa Ricans
Portuguese
5.9%
AMBULATORY DISABILITY
92.6/ 100
METRIC RATING
121st/ 347
METRIC RANK
6.4%
AMBULATORY DISABILITY
4.0/ 100
METRIC RATING
228th/ 347
METRIC RANK
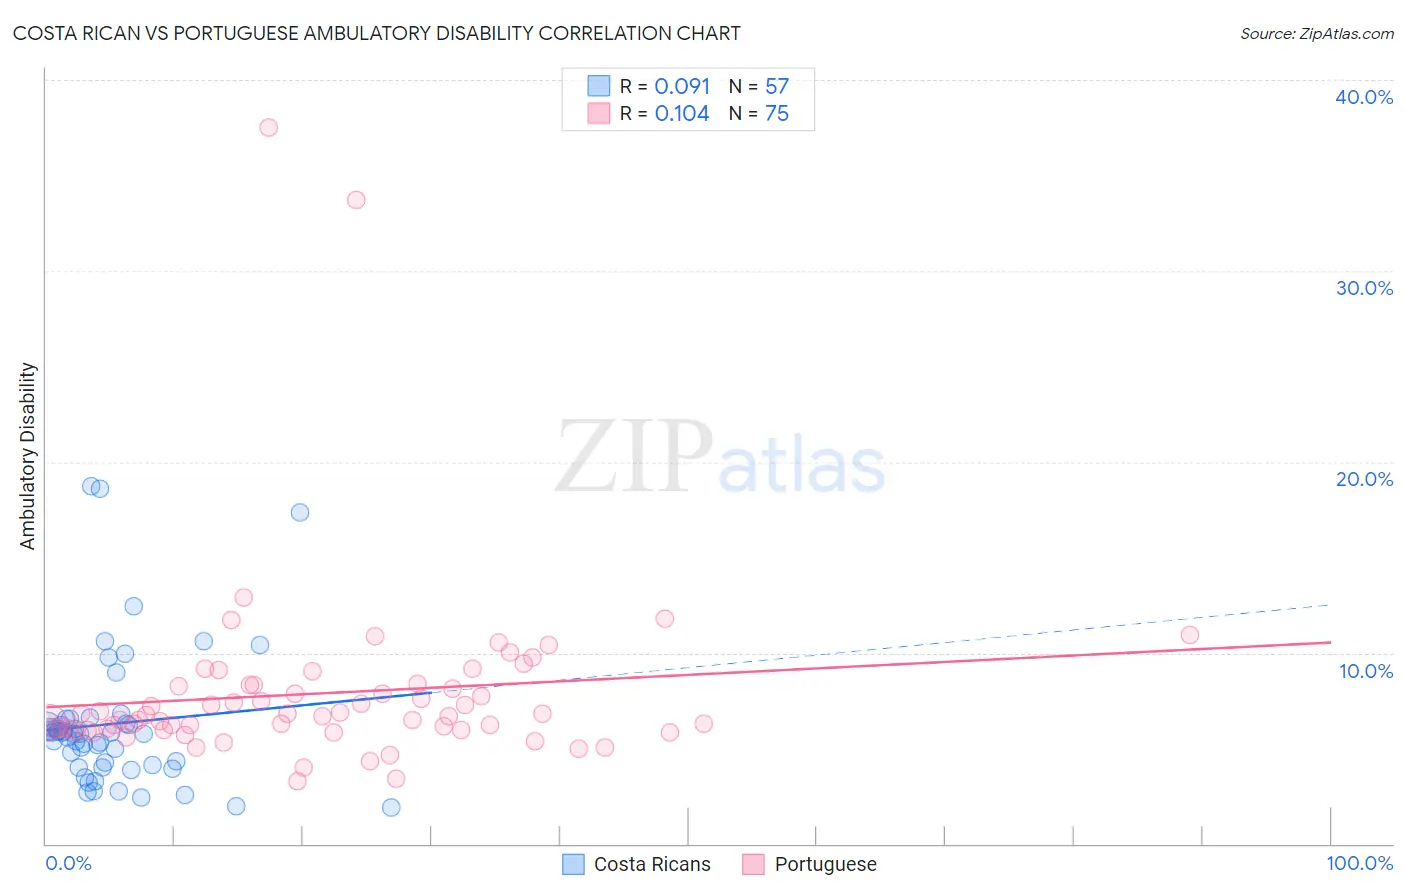
Costa Rican vs Portuguese Ambulatory Disability Correlation Chart
The statistical analysis conducted on geographies consisting of 253,560,556 people shows a slight positive correlation between the proportion of Costa Ricans and percentage of population with ambulatory disability in the United States with a correlation coefficient (R) of 0.091 and weighted average of 5.9%. Similarly, the statistical analysis conducted on geographies consisting of 450,087,424 people shows a poor positive correlation between the proportion of Portuguese and percentage of population with ambulatory disability in the United States with a correlation coefficient (R) of 0.104 and weighted average of 6.4%, a difference of 7.8%.
Ambulatory Disability Correlation Summary
| Measurement | Costa Rican | Portuguese |
| Minimum | 1.9% | 3.3% |
| Maximum | 18.7% | 37.5% |
| Range | 16.8% | 34.2% |
| Mean | 6.3% | 7.9% |
| Median | 5.8% | 6.7% |
| Interquartile 25% (IQ1) | 4.1% | 6.0% |
| Interquartile 75% (IQ3) | 6.4% | 8.3% |
| Interquartile Range (IQR) | 2.3% | 2.3% |
| Standard Deviation (Sample) | 3.6% | 5.0% |
| Standard Deviation (Population) | 3.6% | 5.0% |
Similar Demographics by Ambulatory Disability
Demographics Similar to Costa Ricans by Ambulatory Disability
In terms of ambulatory disability, the demographic groups most similar to Costa Ricans are Icelander (5.9%, a difference of 0.0%), Immigrants from Russia (5.9%, a difference of 0.020%), Immigrants from Middle Africa (5.9%, a difference of 0.060%), Estonian (5.9%, a difference of 0.070%), and Norwegian (5.9%, a difference of 0.11%).
| Demographics | Rating | Rank | Ambulatory Disability |
| Immigrants | Poland | 95.4 /100 | #114 | Exceptional 5.9% |
| South American Indians | 94.8 /100 | #115 | Exceptional 5.9% |
| Immigrants | Africa | 94.7 /100 | #116 | Exceptional 5.9% |
| Immigrants | South Eastern Asia | 93.6 /100 | #117 | Exceptional 5.9% |
| Russians | 93.4 /100 | #118 | Exceptional 5.9% |
| Norwegians | 93.1 /100 | #119 | Exceptional 5.9% |
| Estonians | 92.9 /100 | #120 | Exceptional 5.9% |
| Costa Ricans | 92.6 /100 | #121 | Exceptional 5.9% |
| Icelanders | 92.6 /100 | #122 | Exceptional 5.9% |
| Immigrants | Russia | 92.4 /100 | #123 | Exceptional 5.9% |
| Immigrants | Middle Africa | 92.2 /100 | #124 | Exceptional 5.9% |
| Koreans | 91.6 /100 | #125 | Exceptional 5.9% |
| Arabs | 91.5 /100 | #126 | Exceptional 5.9% |
| Immigrants | Nigeria | 90.9 /100 | #127 | Exceptional 5.9% |
| Immigrants | Western Asia | 90.7 /100 | #128 | Exceptional 5.9% |
Demographics Similar to Portuguese by Ambulatory Disability
In terms of ambulatory disability, the demographic groups most similar to Portuguese are Cuban (6.4%, a difference of 0.010%), Czechoslovakian (6.4%, a difference of 0.050%), Mexican (6.4%, a difference of 0.15%), Panamanian (6.4%, a difference of 0.31%), and Slavic (6.4%, a difference of 0.34%).
| Demographics | Rating | Rank | Ambulatory Disability |
| Hungarians | 9.6 /100 | #221 | Tragic 6.3% |
| German Russians | 9.4 /100 | #222 | Tragic 6.3% |
| Immigrants | Honduras | 7.6 /100 | #223 | Tragic 6.3% |
| Liberians | 7.1 /100 | #224 | Tragic 6.3% |
| Hondurans | 6.3 /100 | #225 | Tragic 6.3% |
| Slavs | 5.1 /100 | #226 | Tragic 6.4% |
| Cubans | 4.0 /100 | #227 | Tragic 6.4% |
| Portuguese | 4.0 /100 | #228 | Tragic 6.4% |
| Czechoslovakians | 3.8 /100 | #229 | Tragic 6.4% |
| Mexicans | 3.5 /100 | #230 | Tragic 6.4% |
| Panamanians | 3.1 /100 | #231 | Tragic 6.4% |
| Assyrians/Chaldeans/Syriacs | 2.4 /100 | #232 | Tragic 6.4% |
| Sub-Saharan Africans | 2.3 /100 | #233 | Tragic 6.4% |
| Immigrants | Liberia | 2.3 /100 | #234 | Tragic 6.4% |
| Hispanics or Latinos | 2.2 /100 | #235 | Tragic 6.4% |