Comanche vs Immigrants from Croatia 7th Grade
COMPARE
Comanche
Immigrants from Croatia
7th Grade
7th Grade Comparison
Comanche
Immigrants from Croatia
95.8%
7TH GRADE
21.1/ 100
METRIC RATING
203rd/ 347
METRIC RANK
96.5%
7TH GRADE
95.0/ 100
METRIC RATING
120th/ 347
METRIC RANK
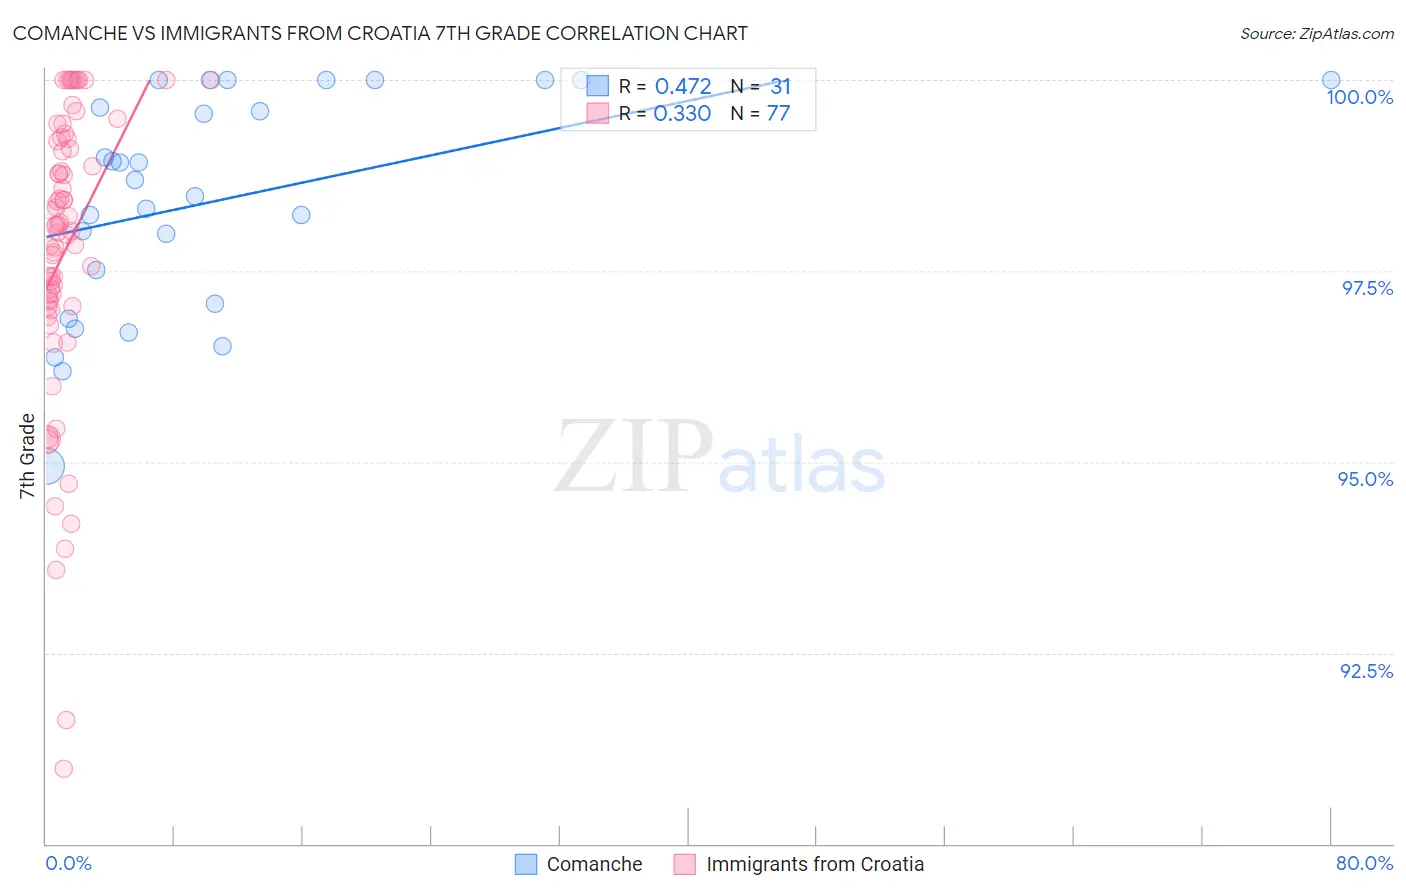
Comanche vs Immigrants from Croatia 7th Grade Correlation Chart
The statistical analysis conducted on geographies consisting of 109,786,530 people shows a moderate positive correlation between the proportion of Comanche and percentage of population with at least 7th grade education in the United States with a correlation coefficient (R) of 0.472 and weighted average of 95.8%. Similarly, the statistical analysis conducted on geographies consisting of 132,548,291 people shows a mild positive correlation between the proportion of Immigrants from Croatia and percentage of population with at least 7th grade education in the United States with a correlation coefficient (R) of 0.330 and weighted average of 96.5%, a difference of 0.66%.
7th Grade Correlation Summary
| Measurement | Comanche | Immigrants from Croatia |
| Minimum | 94.9% | 91.0% |
| Maximum | 100.0% | 100.0% |
| Range | 5.1% | 9.0% |
| Mean | 98.4% | 97.8% |
| Median | 98.7% | 98.1% |
| Interquartile 25% (IQ1) | 97.1% | 97.1% |
| Interquartile 75% (IQ3) | 100.0% | 99.2% |
| Interquartile Range (IQR) | 2.9% | 2.1% |
| Standard Deviation (Sample) | 1.4% | 1.9% |
| Standard Deviation (Population) | 1.4% | 1.9% |
Similar Demographics by 7th Grade
Demographics Similar to Comanche by 7th Grade
In terms of 7th grade, the demographic groups most similar to Comanche are Immigrants from Northern Africa (95.8%, a difference of 0.0%), Immigrants from Argentina (95.9%, a difference of 0.010%), Assyrian/Chaldean/Syriac (95.8%, a difference of 0.010%), Guamanian/Chamorro (95.9%, a difference of 0.020%), and Argentinean (95.9%, a difference of 0.020%).
| Demographics | Rating | Rank | 7th Grade |
| Apache | 27.6 /100 | #196 | Fair 95.9% |
| Immigrants | Zaire | 26.7 /100 | #197 | Fair 95.9% |
| Paraguayans | 24.8 /100 | #198 | Fair 95.9% |
| Guamanians/Chamorros | 23.5 /100 | #199 | Fair 95.9% |
| Argentineans | 23.2 /100 | #200 | Fair 95.9% |
| Immigrants | Argentina | 21.9 /100 | #201 | Fair 95.9% |
| Immigrants | Northern Africa | 21.4 /100 | #202 | Fair 95.8% |
| Comanche | 21.1 /100 | #203 | Fair 95.8% |
| Assyrians/Chaldeans/Syriacs | 20.5 /100 | #204 | Fair 95.8% |
| Moroccans | 18.9 /100 | #205 | Poor 95.8% |
| Africans | 17.6 /100 | #206 | Poor 95.8% |
| Navajo | 17.0 /100 | #207 | Poor 95.8% |
| Immigrants | Sudan | 17.0 /100 | #208 | Poor 95.8% |
| Dutch West Indians | 16.1 /100 | #209 | Poor 95.8% |
| Hawaiians | 16.0 /100 | #210 | Poor 95.8% |
Demographics Similar to Immigrants from Croatia by 7th Grade
In terms of 7th grade, the demographic groups most similar to Immigrants from Croatia are Cheyenne (96.5%, a difference of 0.0%), Immigrants from Japan (96.5%, a difference of 0.010%), Immigrants from Norway (96.5%, a difference of 0.010%), Immigrants from Europe (96.5%, a difference of 0.010%), and Immigrants from France (96.5%, a difference of 0.010%).
| Demographics | Rating | Rank | 7th Grade |
| Pueblo | 96.8 /100 | #113 | Exceptional 96.5% |
| Immigrants | Zimbabwe | 96.6 /100 | #114 | Exceptional 96.5% |
| Choctaw | 96.6 /100 | #115 | Exceptional 96.5% |
| Syrians | 96.6 /100 | #116 | Exceptional 96.5% |
| Immigrants | Moldova | 95.7 /100 | #117 | Exceptional 96.5% |
| Immigrants | Japan | 95.5 /100 | #118 | Exceptional 96.5% |
| Immigrants | Norway | 95.2 /100 | #119 | Exceptional 96.5% |
| Immigrants | Croatia | 95.0 /100 | #120 | Exceptional 96.5% |
| Cheyenne | 94.9 /100 | #121 | Exceptional 96.5% |
| Immigrants | Europe | 94.8 /100 | #122 | Exceptional 96.5% |
| Immigrants | France | 94.7 /100 | #123 | Exceptional 96.5% |
| Immigrants | Switzerland | 94.5 /100 | #124 | Exceptional 96.5% |
| Immigrants | Bulgaria | 94.0 /100 | #125 | Exceptional 96.4% |
| Palestinians | 93.5 /100 | #126 | Exceptional 96.4% |
| Immigrants | Bosnia and Herzegovina | 93.3 /100 | #127 | Exceptional 96.4% |