Comanche vs South African Disability
COMPARE
Comanche
South African
Disability
Disability Comparison
Comanche
South Africans
14.1%
DISABILITY
0.0/ 100
METRIC RATING
323rd/ 347
METRIC RANK
11.4%
DISABILITY
92.3/ 100
METRIC RATING
123rd/ 347
METRIC RANK
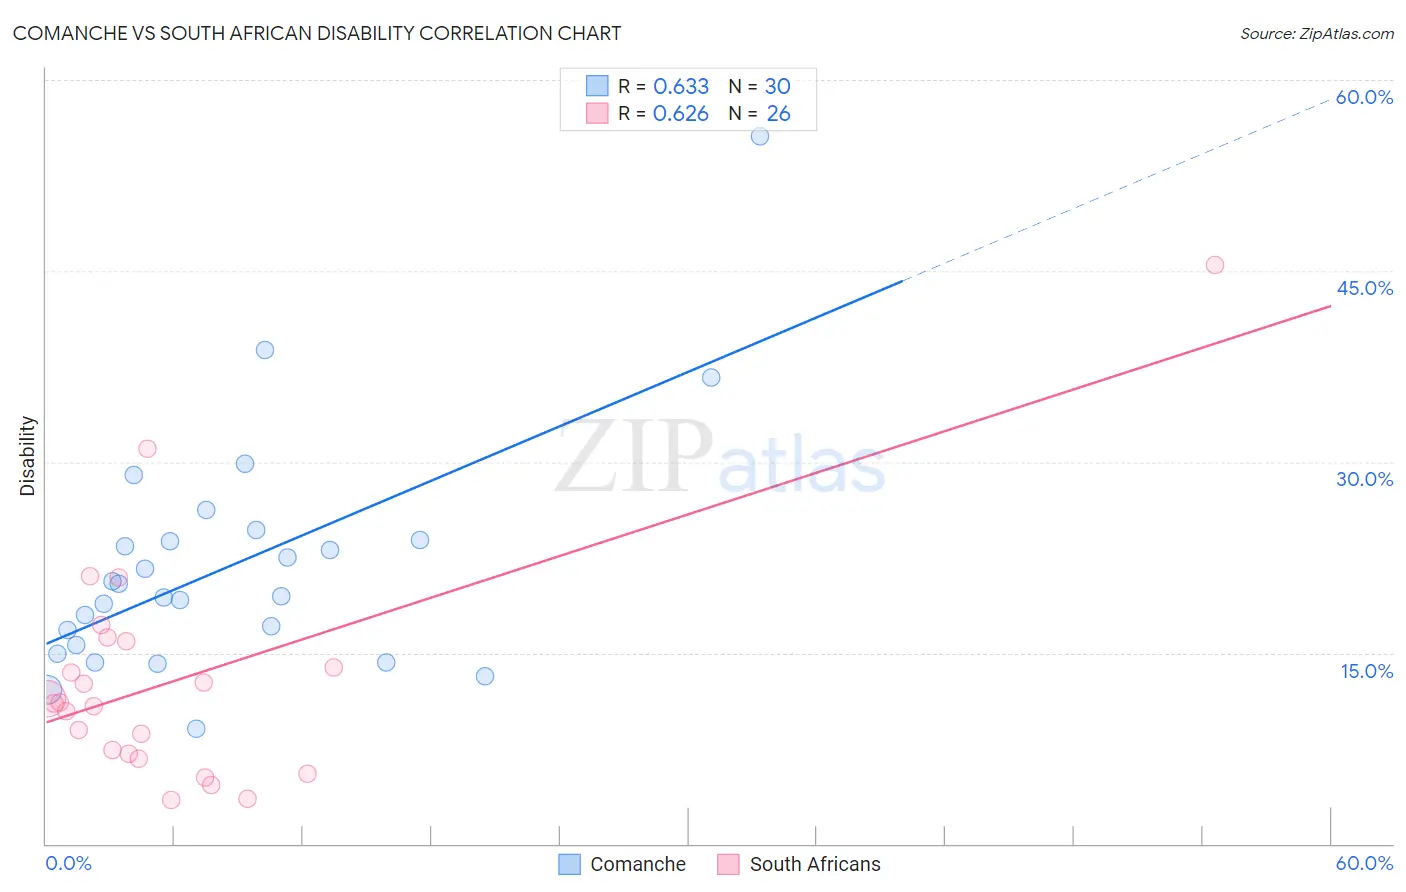
Comanche vs South African Disability Correlation Chart
The statistical analysis conducted on geographies consisting of 109,776,757 people shows a significant positive correlation between the proportion of Comanche and percentage of population with a disability in the United States with a correlation coefficient (R) of 0.633 and weighted average of 14.1%. Similarly, the statistical analysis conducted on geographies consisting of 182,593,286 people shows a significant positive correlation between the proportion of South Africans and percentage of population with a disability in the United States with a correlation coefficient (R) of 0.626 and weighted average of 11.4%, a difference of 24.1%.
Disability Correlation Summary
| Measurement | Comanche | South African |
| Minimum | 9.0% | 3.4% |
| Maximum | 55.6% | 45.5% |
| Range | 46.5% | 42.0% |
| Mean | 21.9% | 12.9% |
| Median | 19.9% | 11.1% |
| Interquartile 25% (IQ1) | 15.6% | 7.0% |
| Interquartile 75% (IQ3) | 23.8% | 15.9% |
| Interquartile Range (IQR) | 8.3% | 8.9% |
| Standard Deviation (Sample) | 9.3% | 9.1% |
| Standard Deviation (Population) | 9.1% | 8.9% |
Similar Demographics by Disability
Demographics Similar to Comanche by Disability
In terms of disability, the demographic groups most similar to Comanche are Chippewa (14.1%, a difference of 0.20%), Native/Alaskan (14.2%, a difference of 0.25%), Osage (14.2%, a difference of 0.28%), Ottawa (14.2%, a difference of 0.30%), and Immigrants from the Azores (14.2%, a difference of 0.30%).
| Demographics | Rating | Rank | Disability |
| Pima | 0.0 /100 | #316 | Tragic 13.7% |
| Immigrants | Cabo Verde | 0.0 /100 | #317 | Tragic 13.7% |
| Menominee | 0.0 /100 | #318 | Tragic 13.8% |
| Iroquois | 0.0 /100 | #319 | Tragic 13.8% |
| Apache | 0.0 /100 | #320 | Tragic 13.9% |
| Paiute | 0.0 /100 | #321 | Tragic 13.9% |
| Americans | 0.0 /100 | #322 | Tragic 13.9% |
| Comanche | 0.0 /100 | #323 | Tragic 14.1% |
| Chippewa | 0.0 /100 | #324 | Tragic 14.1% |
| Natives/Alaskans | 0.0 /100 | #325 | Tragic 14.2% |
| Osage | 0.0 /100 | #326 | Tragic 14.2% |
| Ottawa | 0.0 /100 | #327 | Tragic 14.2% |
| Immigrants | Azores | 0.0 /100 | #328 | Tragic 14.2% |
| Potawatomi | 0.0 /100 | #329 | Tragic 14.2% |
| Navajo | 0.0 /100 | #330 | Tragic 14.3% |
Demographics Similar to South Africans by Disability
In terms of disability, the demographic groups most similar to South Africans are South American Indian (11.4%, a difference of 0.020%), Costa Rican (11.4%, a difference of 0.060%), Brazilian (11.4%, a difference of 0.17%), Immigrants from Costa Rica (11.4%, a difference of 0.20%), and Central American (11.4%, a difference of 0.21%).
| Demographics | Rating | Rank | Disability |
| Immigrants | Northern Europe | 94.1 /100 | #116 | Exceptional 11.3% |
| Luxembourgers | 93.9 /100 | #117 | Exceptional 11.3% |
| Koreans | 93.8 /100 | #118 | Exceptional 11.3% |
| Central Americans | 93.5 /100 | #119 | Exceptional 11.4% |
| Immigrants | North Macedonia | 93.5 /100 | #120 | Exceptional 11.4% |
| Immigrants | Costa Rica | 93.4 /100 | #121 | Exceptional 11.4% |
| Brazilians | 93.3 /100 | #122 | Exceptional 11.4% |
| South Africans | 92.3 /100 | #123 | Exceptional 11.4% |
| South American Indians | 92.2 /100 | #124 | Exceptional 11.4% |
| Costa Ricans | 91.9 /100 | #125 | Exceptional 11.4% |
| Immigrants | Latvia | 90.9 /100 | #126 | Exceptional 11.4% |
| Immigrants | Italy | 90.4 /100 | #127 | Exceptional 11.4% |
| Immigrants | Europe | 90.4 /100 | #128 | Exceptional 11.4% |
| Macedonians | 90.3 /100 | #129 | Exceptional 11.4% |
| Latvians | 89.8 /100 | #130 | Excellent 11.4% |