Comanche vs Estonian Disability
COMPARE
Comanche
Estonian
Disability
Disability Comparison
Comanche
Estonians
14.1%
DISABILITY
0.0/ 100
METRIC RATING
323rd/ 347
METRIC RANK
11.7%
DISABILITY
54.4/ 100
METRIC RATING
167th/ 347
METRIC RANK
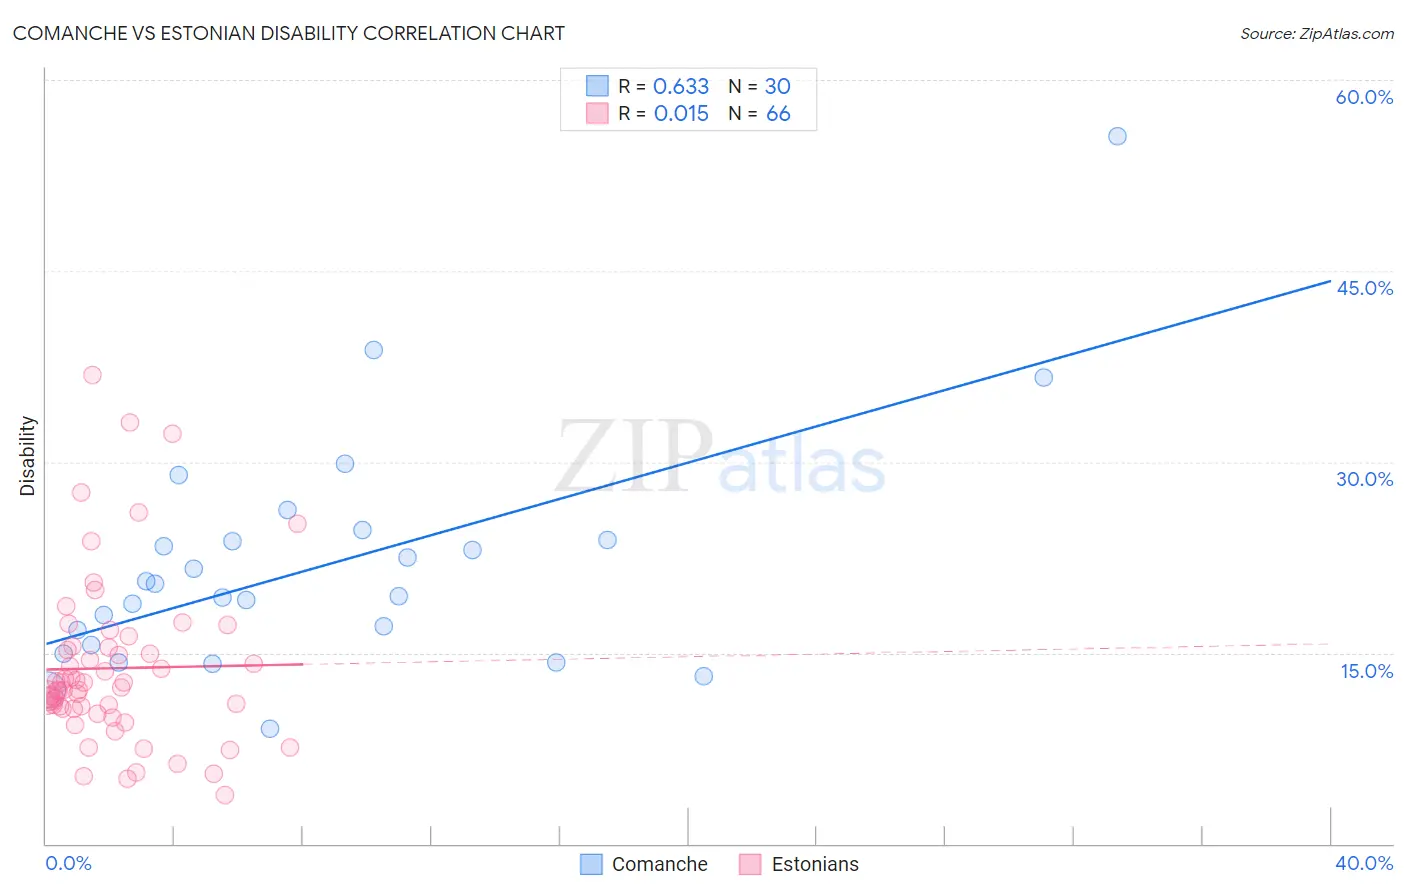
Comanche vs Estonian Disability Correlation Chart
The statistical analysis conducted on geographies consisting of 109,776,757 people shows a significant positive correlation between the proportion of Comanche and percentage of population with a disability in the United States with a correlation coefficient (R) of 0.633 and weighted average of 14.1%. Similarly, the statistical analysis conducted on geographies consisting of 123,527,631 people shows no correlation between the proportion of Estonians and percentage of population with a disability in the United States with a correlation coefficient (R) of 0.015 and weighted average of 11.7%, a difference of 20.9%.
Disability Correlation Summary
| Measurement | Comanche | Estonian |
| Minimum | 9.0% | 3.8% |
| Maximum | 55.6% | 36.8% |
| Range | 46.5% | 33.0% |
| Mean | 21.9% | 13.8% |
| Median | 19.9% | 12.2% |
| Interquartile 25% (IQ1) | 15.6% | 10.7% |
| Interquartile 75% (IQ3) | 23.8% | 15.4% |
| Interquartile Range (IQR) | 8.3% | 4.8% |
| Standard Deviation (Sample) | 9.3% | 6.6% |
| Standard Deviation (Population) | 9.1% | 6.5% |
Similar Demographics by Disability
Demographics Similar to Comanche by Disability
In terms of disability, the demographic groups most similar to Comanche are Chippewa (14.1%, a difference of 0.20%), Native/Alaskan (14.2%, a difference of 0.25%), Osage (14.2%, a difference of 0.28%), Ottawa (14.2%, a difference of 0.30%), and Immigrants from the Azores (14.2%, a difference of 0.30%).
| Demographics | Rating | Rank | Disability |
| Pima | 0.0 /100 | #316 | Tragic 13.7% |
| Immigrants | Cabo Verde | 0.0 /100 | #317 | Tragic 13.7% |
| Menominee | 0.0 /100 | #318 | Tragic 13.8% |
| Iroquois | 0.0 /100 | #319 | Tragic 13.8% |
| Apache | 0.0 /100 | #320 | Tragic 13.9% |
| Paiute | 0.0 /100 | #321 | Tragic 13.9% |
| Americans | 0.0 /100 | #322 | Tragic 13.9% |
| Comanche | 0.0 /100 | #323 | Tragic 14.1% |
| Chippewa | 0.0 /100 | #324 | Tragic 14.1% |
| Natives/Alaskans | 0.0 /100 | #325 | Tragic 14.2% |
| Osage | 0.0 /100 | #326 | Tragic 14.2% |
| Ottawa | 0.0 /100 | #327 | Tragic 14.2% |
| Immigrants | Azores | 0.0 /100 | #328 | Tragic 14.2% |
| Potawatomi | 0.0 /100 | #329 | Tragic 14.2% |
| Navajo | 0.0 /100 | #330 | Tragic 14.3% |
Demographics Similar to Estonians by Disability
In terms of disability, the demographic groups most similar to Estonians are Pakistani (11.7%, a difference of 0.010%), Immigrants from Latin America (11.7%, a difference of 0.020%), Immigrants from Austria (11.7%, a difference of 0.050%), Immigrants from Albania (11.7%, a difference of 0.070%), and Immigrants from Southern Europe (11.7%, a difference of 0.070%).
| Demographics | Rating | Rank | Disability |
| Immigrants | Barbados | 64.2 /100 | #160 | Good 11.6% |
| Immigrants | Cuba | 62.8 /100 | #161 | Good 11.6% |
| Immigrants | Haiti | 59.2 /100 | #162 | Average 11.7% |
| Immigrants | Trinidad and Tobago | 58.9 /100 | #163 | Average 11.7% |
| Syrians | 58.5 /100 | #164 | Average 11.7% |
| Cubans | 56.7 /100 | #165 | Average 11.7% |
| Pakistanis | 54.7 /100 | #166 | Average 11.7% |
| Estonians | 54.4 /100 | #167 | Average 11.7% |
| Immigrants | Latin America | 54.1 /100 | #168 | Average 11.7% |
| Immigrants | Austria | 53.4 /100 | #169 | Average 11.7% |
| Immigrants | Albania | 52.8 /100 | #170 | Average 11.7% |
| Immigrants | Southern Europe | 52.8 /100 | #171 | Average 11.7% |
| Trinidadians and Tobagonians | 52.7 /100 | #172 | Average 11.7% |
| Maltese | 50.6 /100 | #173 | Average 11.7% |
| Albanians | 50.0 /100 | #174 | Average 11.7% |