Comanche vs Alsatian Hearing Disability
COMPARE
Comanche
Alsatian
Hearing Disability
Hearing Disability Comparison
Comanche
Alsatians
4.0%
HEARING DISABILITY
0.0/ 100
METRIC RATING
317th/ 347
METRIC RANK
3.1%
HEARING DISABILITY
15.9/ 100
METRIC RATING
205th/ 347
METRIC RANK
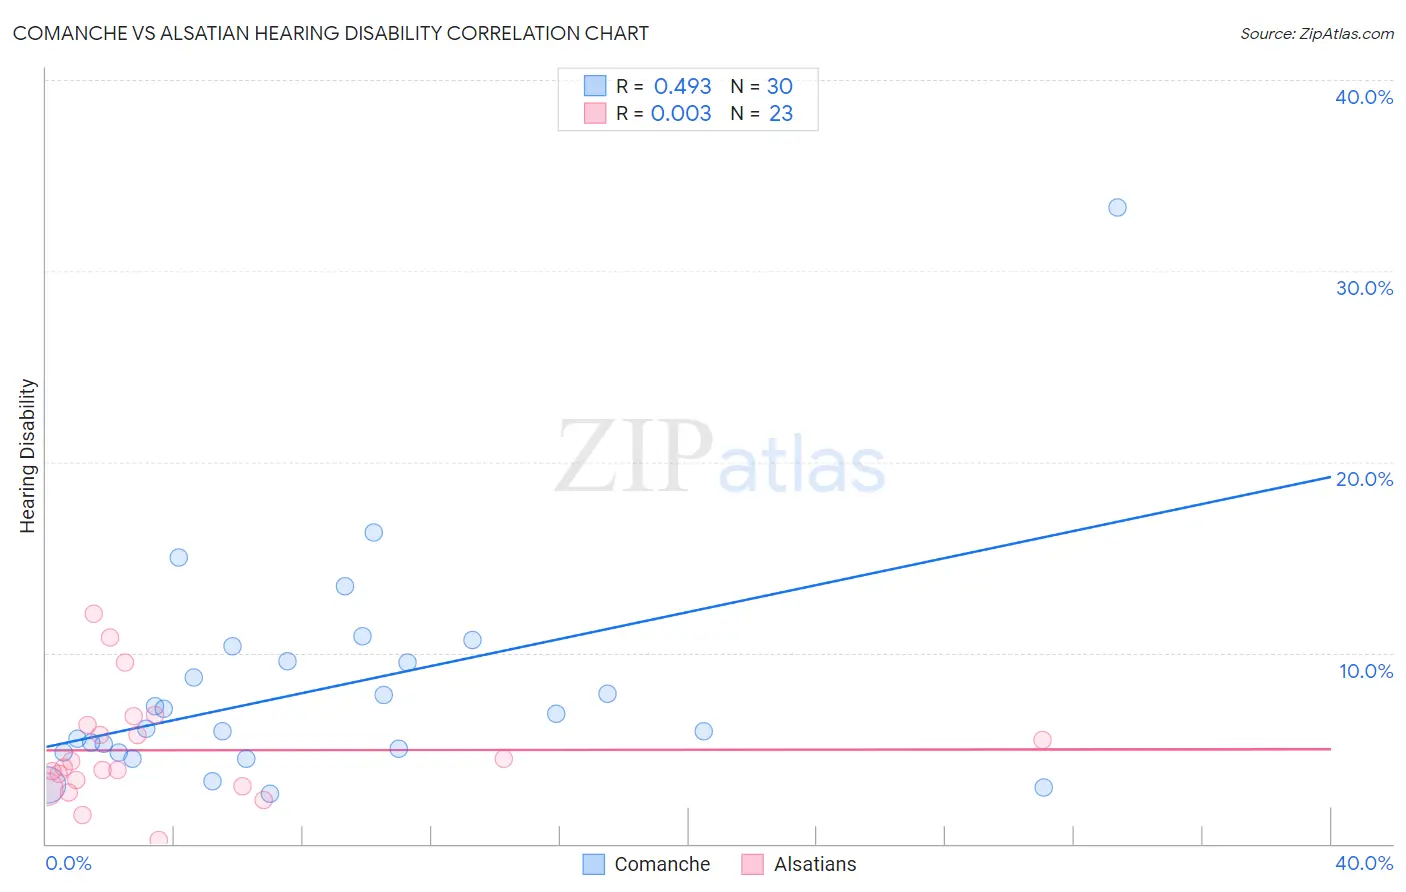
Comanche vs Alsatian Hearing Disability Correlation Chart
The statistical analysis conducted on geographies consisting of 109,751,188 people shows a moderate positive correlation between the proportion of Comanche and percentage of population with hearing disability in the United States with a correlation coefficient (R) of 0.493 and weighted average of 4.0%. Similarly, the statistical analysis conducted on geographies consisting of 82,680,655 people shows no correlation between the proportion of Alsatians and percentage of population with hearing disability in the United States with a correlation coefficient (R) of 0.003 and weighted average of 3.1%, a difference of 27.3%.
Hearing Disability Correlation Summary
| Measurement | Comanche | Alsatian |
| Minimum | 2.6% | 0.22% |
| Maximum | 33.3% | 12.1% |
| Range | 30.7% | 11.9% |
| Mean | 8.1% | 4.9% |
| Median | 6.4% | 4.0% |
| Interquartile 25% (IQ1) | 4.8% | 3.0% |
| Interquartile 75% (IQ3) | 9.6% | 6.2% |
| Interquartile Range (IQR) | 4.8% | 3.2% |
| Standard Deviation (Sample) | 5.9% | 2.8% |
| Standard Deviation (Population) | 5.8% | 2.8% |
Similar Demographics by Hearing Disability
Demographics Similar to Comanche by Hearing Disability
In terms of hearing disability, the demographic groups most similar to Comanche are Spanish American (4.0%, a difference of 0.13%), Cheyenne (4.0%, a difference of 0.17%), Puget Sound Salish (3.9%, a difference of 0.33%), Yakama (3.9%, a difference of 0.34%), and Hopi (3.9%, a difference of 0.51%).
| Demographics | Rating | Rank | Hearing Disability |
| Cree | 0.0 /100 | #310 | Tragic 3.8% |
| Americans | 0.0 /100 | #311 | Tragic 3.9% |
| Cajuns | 0.0 /100 | #312 | Tragic 3.9% |
| Hopi | 0.0 /100 | #313 | Tragic 3.9% |
| Yakama | 0.0 /100 | #314 | Tragic 3.9% |
| Puget Sound Salish | 0.0 /100 | #315 | Tragic 3.9% |
| Spanish Americans | 0.0 /100 | #316 | Tragic 4.0% |
| Comanche | 0.0 /100 | #317 | Tragic 4.0% |
| Cheyenne | 0.0 /100 | #318 | Tragic 4.0% |
| Chippewa | 0.0 /100 | #319 | Tragic 4.0% |
| Shoshone | 0.0 /100 | #320 | Tragic 4.0% |
| Paiute | 0.0 /100 | #321 | Tragic 4.1% |
| Seminole | 0.0 /100 | #322 | Tragic 4.1% |
| Apache | 0.0 /100 | #323 | Tragic 4.1% |
| Osage | 0.0 /100 | #324 | Tragic 4.1% |
Demographics Similar to Alsatians by Hearing Disability
In terms of hearing disability, the demographic groups most similar to Alsatians are Immigrants from Czechoslovakia (3.1%, a difference of 0.0%), Immigrants from Denmark (3.1%, a difference of 0.050%), Eastern European (3.1%, a difference of 0.070%), Immigrants from Thailand (3.1%, a difference of 0.090%), and Hispanic or Latino (3.1%, a difference of 0.13%).
| Demographics | Rating | Rank | Hearing Disability |
| Immigrants | Croatia | 20.5 /100 | #198 | Fair 3.1% |
| Syrians | 19.2 /100 | #199 | Poor 3.1% |
| Immigrants | North Macedonia | 19.1 /100 | #200 | Poor 3.1% |
| Iraqis | 19.0 /100 | #201 | Poor 3.1% |
| Immigrants | Thailand | 16.4 /100 | #202 | Poor 3.1% |
| Immigrants | Denmark | 16.2 /100 | #203 | Poor 3.1% |
| Immigrants | Czechoslovakia | 15.9 /100 | #204 | Poor 3.1% |
| Alsatians | 15.9 /100 | #205 | Poor 3.1% |
| Eastern Europeans | 15.5 /100 | #206 | Poor 3.1% |
| Hispanics or Latinos | 15.1 /100 | #207 | Poor 3.1% |
| Immigrants | Latvia | 12.7 /100 | #208 | Poor 3.1% |
| Immigrants | Hungary | 12.5 /100 | #209 | Poor 3.1% |
| Cape Verdeans | 12.2 /100 | #210 | Poor 3.1% |
| Romanians | 12.1 /100 | #211 | Poor 3.1% |
| Pakistanis | 11.1 /100 | #212 | Poor 3.1% |