Comanche vs Cheyenne Hearing Disability
COMPARE
Comanche
Cheyenne
Hearing Disability
Hearing Disability Comparison
Comanche
Cheyenne
4.0%
HEARING DISABILITY
0.0/ 100
METRIC RATING
317th/ 347
METRIC RANK
4.0%
HEARING DISABILITY
0.0/ 100
METRIC RATING
318th/ 347
METRIC RANK
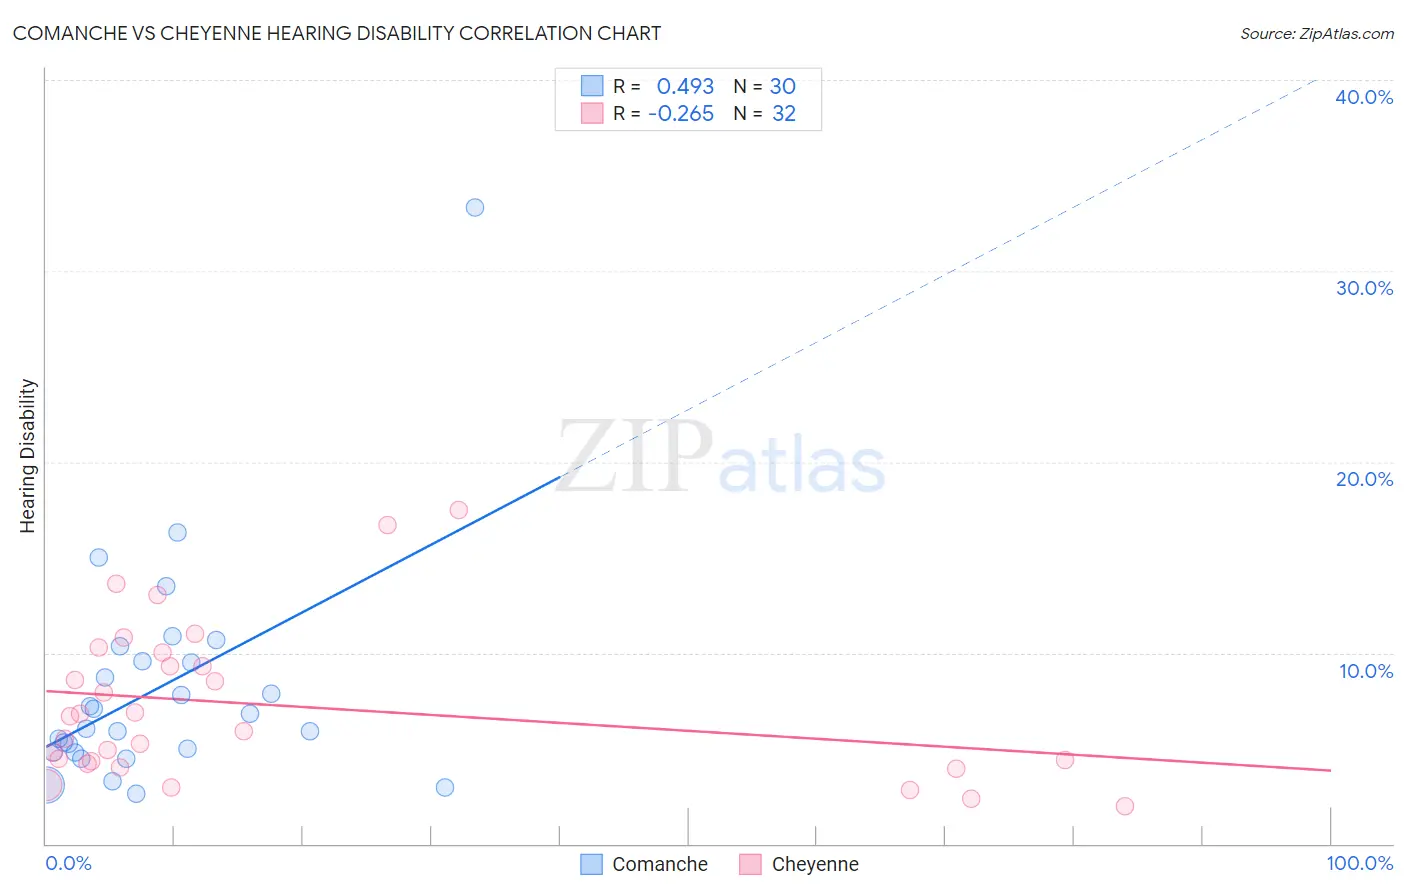
Comanche vs Cheyenne Hearing Disability Correlation Chart
The statistical analysis conducted on geographies consisting of 109,751,188 people shows a moderate positive correlation between the proportion of Comanche and percentage of population with hearing disability in the United States with a correlation coefficient (R) of 0.493 and weighted average of 4.0%. Similarly, the statistical analysis conducted on geographies consisting of 80,707,533 people shows a weak negative correlation between the proportion of Cheyenne and percentage of population with hearing disability in the United States with a correlation coefficient (R) of -0.265 and weighted average of 4.0%, a difference of 0.17%.
Hearing Disability Correlation Summary
| Measurement | Comanche | Cheyenne |
| Minimum | 2.6% | 2.0% |
| Maximum | 33.3% | 17.5% |
| Range | 30.7% | 15.5% |
| Mean | 8.1% | 7.2% |
| Median | 6.4% | 6.3% |
| Interquartile 25% (IQ1) | 4.8% | 4.2% |
| Interquartile 75% (IQ3) | 9.6% | 9.6% |
| Interquartile Range (IQR) | 4.8% | 5.4% |
| Standard Deviation (Sample) | 5.9% | 4.0% |
| Standard Deviation (Population) | 5.8% | 4.0% |
Demographics Similar to Comanche and Cheyenne by Hearing Disability
In terms of hearing disability, the demographic groups most similar to Comanche are Spanish American (4.0%, a difference of 0.13%), Puget Sound Salish (3.9%, a difference of 0.33%), Yakama (3.9%, a difference of 0.34%), Hopi (3.9%, a difference of 0.51%), and Cajun (3.9%, a difference of 0.62%). Similarly, the demographic groups most similar to Cheyenne are Spanish American (4.0%, a difference of 0.31%), Puget Sound Salish (3.9%, a difference of 0.51%), Yakama (3.9%, a difference of 0.52%), Chippewa (4.0%, a difference of 0.65%), and Hopi (3.9%, a difference of 0.69%).
| Demographics | Rating | Rank | Hearing Disability |
| French Canadians | 0.0 /100 | #307 | Tragic 3.8% |
| Ottawa | 0.0 /100 | #308 | Tragic 3.8% |
| Scotch-Irish | 0.0 /100 | #309 | Tragic 3.8% |
| Cree | 0.0 /100 | #310 | Tragic 3.8% |
| Americans | 0.0 /100 | #311 | Tragic 3.9% |
| Cajuns | 0.0 /100 | #312 | Tragic 3.9% |
| Hopi | 0.0 /100 | #313 | Tragic 3.9% |
| Yakama | 0.0 /100 | #314 | Tragic 3.9% |
| Puget Sound Salish | 0.0 /100 | #315 | Tragic 3.9% |
| Spanish Americans | 0.0 /100 | #316 | Tragic 4.0% |
| Comanche | 0.0 /100 | #317 | Tragic 4.0% |
| Cheyenne | 0.0 /100 | #318 | Tragic 4.0% |
| Chippewa | 0.0 /100 | #319 | Tragic 4.0% |
| Shoshone | 0.0 /100 | #320 | Tragic 4.0% |
| Paiute | 0.0 /100 | #321 | Tragic 4.1% |
| Seminole | 0.0 /100 | #322 | Tragic 4.1% |
| Apache | 0.0 /100 | #323 | Tragic 4.1% |
| Osage | 0.0 /100 | #324 | Tragic 4.1% |
| Lumbee | 0.0 /100 | #325 | Tragic 4.1% |
| Potawatomi | 0.0 /100 | #326 | Tragic 4.1% |
| Arapaho | 0.0 /100 | #327 | Tragic 4.1% |