Immigrants from Kuwait vs Alsatian Hearing Disability
COMPARE
Immigrants from Kuwait
Alsatian
Hearing Disability
Hearing Disability Comparison
Immigrants from Kuwait
Alsatians
2.8%
HEARING DISABILITY
96.3/ 100
METRIC RATING
93rd/ 347
METRIC RANK
3.1%
HEARING DISABILITY
15.9/ 100
METRIC RATING
205th/ 347
METRIC RANK
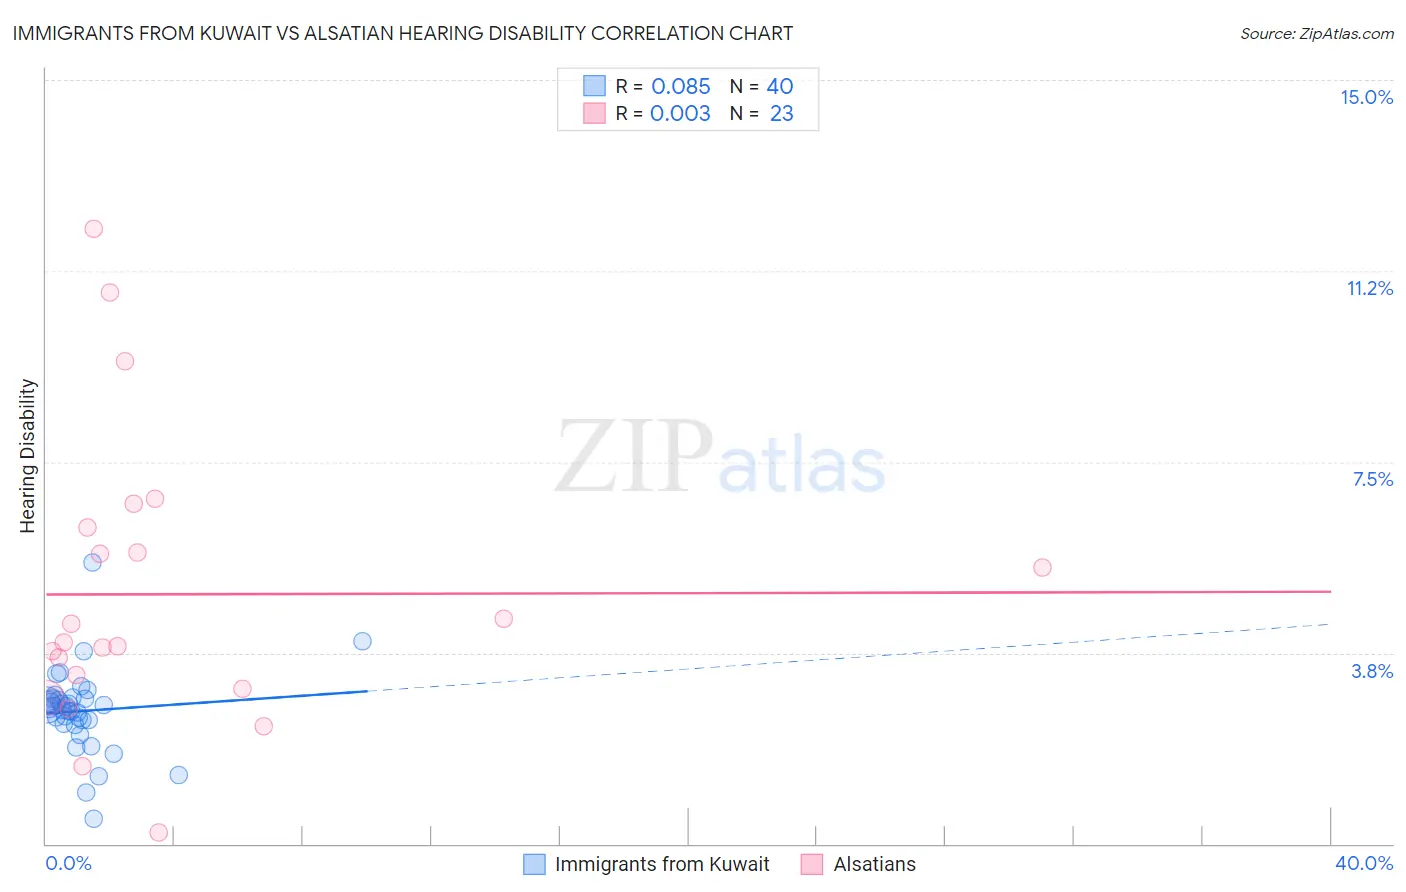
Immigrants from Kuwait vs Alsatian Hearing Disability Correlation Chart
The statistical analysis conducted on geographies consisting of 136,905,623 people shows a slight positive correlation between the proportion of Immigrants from Kuwait and percentage of population with hearing disability in the United States with a correlation coefficient (R) of 0.085 and weighted average of 2.8%. Similarly, the statistical analysis conducted on geographies consisting of 82,680,655 people shows no correlation between the proportion of Alsatians and percentage of population with hearing disability in the United States with a correlation coefficient (R) of 0.003 and weighted average of 3.1%, a difference of 12.5%.
Hearing Disability Correlation Summary
| Measurement | Immigrants from Kuwait | Alsatian |
| Minimum | 0.48% | 0.22% |
| Maximum | 5.5% | 12.1% |
| Range | 5.0% | 11.9% |
| Mean | 2.6% | 4.9% |
| Median | 2.7% | 4.0% |
| Interquartile 25% (IQ1) | 2.4% | 3.0% |
| Interquartile 75% (IQ3) | 2.9% | 6.2% |
| Interquartile Range (IQR) | 0.46% | 3.2% |
| Standard Deviation (Sample) | 0.82% | 2.8% |
| Standard Deviation (Population) | 0.81% | 2.8% |
Similar Demographics by Hearing Disability
Demographics Similar to Immigrants from Kuwait by Hearing Disability
In terms of hearing disability, the demographic groups most similar to Immigrants from Kuwait are Iranian (2.8%, a difference of 0.12%), Immigrants from Middle Africa (2.8%, a difference of 0.15%), Immigrants from Morocco (2.8%, a difference of 0.23%), Belizean (2.8%, a difference of 0.26%), and Uruguayan (2.8%, a difference of 0.27%).
| Demographics | Rating | Rank | Hearing Disability |
| Immigrants | Iran | 96.8 /100 | #86 | Exceptional 2.8% |
| Somalis | 96.7 /100 | #87 | Exceptional 2.8% |
| Immigrants | Turkey | 96.7 /100 | #88 | Exceptional 2.8% |
| Belizeans | 96.6 /100 | #89 | Exceptional 2.8% |
| Immigrants | Morocco | 96.6 /100 | #90 | Exceptional 2.8% |
| Immigrants | Middle Africa | 96.5 /100 | #91 | Exceptional 2.8% |
| Iranians | 96.4 /100 | #92 | Exceptional 2.8% |
| Immigrants | Kuwait | 96.3 /100 | #93 | Exceptional 2.8% |
| Uruguayans | 95.9 /100 | #94 | Exceptional 2.8% |
| Israelis | 95.9 /100 | #95 | Exceptional 2.8% |
| Immigrants | Somalia | 95.5 /100 | #96 | Exceptional 2.8% |
| Immigrants | Afghanistan | 95.3 /100 | #97 | Exceptional 2.8% |
| Immigrants | Honduras | 95.1 /100 | #98 | Exceptional 2.8% |
| Immigrants | Guatemala | 95.1 /100 | #99 | Exceptional 2.8% |
| Immigrants | Eastern Africa | 95.0 /100 | #100 | Exceptional 2.8% |
Demographics Similar to Alsatians by Hearing Disability
In terms of hearing disability, the demographic groups most similar to Alsatians are Immigrants from Czechoslovakia (3.1%, a difference of 0.0%), Immigrants from Denmark (3.1%, a difference of 0.050%), Eastern European (3.1%, a difference of 0.070%), Immigrants from Thailand (3.1%, a difference of 0.090%), and Hispanic or Latino (3.1%, a difference of 0.13%).
| Demographics | Rating | Rank | Hearing Disability |
| Immigrants | Croatia | 20.5 /100 | #198 | Fair 3.1% |
| Syrians | 19.2 /100 | #199 | Poor 3.1% |
| Immigrants | North Macedonia | 19.1 /100 | #200 | Poor 3.1% |
| Iraqis | 19.0 /100 | #201 | Poor 3.1% |
| Immigrants | Thailand | 16.4 /100 | #202 | Poor 3.1% |
| Immigrants | Denmark | 16.2 /100 | #203 | Poor 3.1% |
| Immigrants | Czechoslovakia | 15.9 /100 | #204 | Poor 3.1% |
| Alsatians | 15.9 /100 | #205 | Poor 3.1% |
| Eastern Europeans | 15.5 /100 | #206 | Poor 3.1% |
| Hispanics or Latinos | 15.1 /100 | #207 | Poor 3.1% |
| Immigrants | Latvia | 12.7 /100 | #208 | Poor 3.1% |
| Immigrants | Hungary | 12.5 /100 | #209 | Poor 3.1% |
| Cape Verdeans | 12.2 /100 | #210 | Poor 3.1% |
| Romanians | 12.1 /100 | #211 | Poor 3.1% |
| Pakistanis | 11.1 /100 | #212 | Poor 3.1% |