Austrian vs Alsatian Hearing Disability
COMPARE
Austrian
Alsatian
Hearing Disability
Hearing Disability Comparison
Austrians
Alsatians
3.4%
HEARING DISABILITY
0.6/ 100
METRIC RATING
248th/ 347
METRIC RANK
3.1%
HEARING DISABILITY
15.9/ 100
METRIC RATING
205th/ 347
METRIC RANK
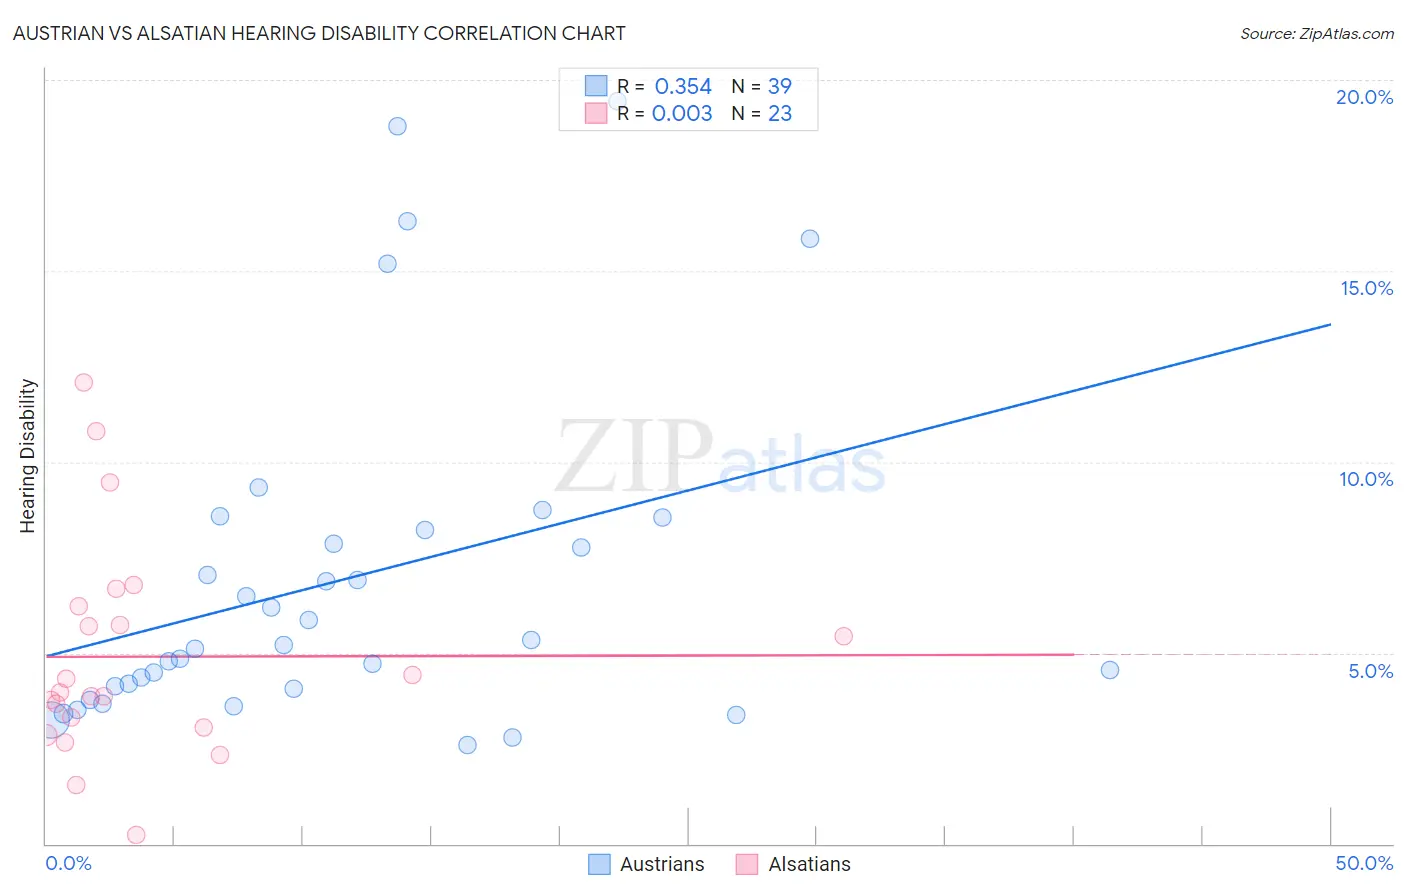
Austrian vs Alsatian Hearing Disability Correlation Chart
The statistical analysis conducted on geographies consisting of 451,912,592 people shows a mild positive correlation between the proportion of Austrians and percentage of population with hearing disability in the United States with a correlation coefficient (R) of 0.354 and weighted average of 3.4%. Similarly, the statistical analysis conducted on geographies consisting of 82,680,655 people shows no correlation between the proportion of Alsatians and percentage of population with hearing disability in the United States with a correlation coefficient (R) of 0.003 and weighted average of 3.1%, a difference of 7.9%.
Hearing Disability Correlation Summary
| Measurement | Austrian | Alsatian |
| Minimum | 2.6% | 0.22% |
| Maximum | 19.4% | 12.1% |
| Range | 16.9% | 11.9% |
| Mean | 6.9% | 4.9% |
| Median | 5.2% | 4.0% |
| Interquartile 25% (IQ1) | 4.1% | 3.0% |
| Interquartile 75% (IQ3) | 8.2% | 6.2% |
| Interquartile Range (IQR) | 4.2% | 3.2% |
| Standard Deviation (Sample) | 4.4% | 2.8% |
| Standard Deviation (Population) | 4.3% | 2.8% |
Similar Demographics by Hearing Disability
Demographics Similar to Austrians by Hearing Disability
In terms of hearing disability, the demographic groups most similar to Austrians are Lithuanian (3.4%, a difference of 0.22%), Immigrants from England (3.3%, a difference of 0.42%), Italian (3.4%, a difference of 0.53%), Yuman (3.4%, a difference of 0.54%), and Immigrants from Scotland (3.3%, a difference of 0.71%).
| Demographics | Rating | Rank | Hearing Disability |
| Samoans | 1.1 /100 | #241 | Tragic 3.3% |
| Yugoslavians | 1.0 /100 | #242 | Tragic 3.3% |
| Immigrants | Western Europe | 1.0 /100 | #243 | Tragic 3.3% |
| Assyrians/Chaldeans/Syriacs | 0.9 /100 | #244 | Tragic 3.3% |
| Immigrants | Scotland | 0.8 /100 | #245 | Tragic 3.3% |
| Immigrants | England | 0.7 /100 | #246 | Tragic 3.3% |
| Lithuanians | 0.6 /100 | #247 | Tragic 3.4% |
| Austrians | 0.6 /100 | #248 | Tragic 3.4% |
| Italians | 0.4 /100 | #249 | Tragic 3.4% |
| Yuman | 0.4 /100 | #250 | Tragic 3.4% |
| Hungarians | 0.4 /100 | #251 | Tragic 3.4% |
| Croatians | 0.4 /100 | #252 | Tragic 3.4% |
| Carpatho Rusyns | 0.3 /100 | #253 | Tragic 3.4% |
| Slavs | 0.2 /100 | #254 | Tragic 3.4% |
| Poles | 0.2 /100 | #255 | Tragic 3.4% |
Demographics Similar to Alsatians by Hearing Disability
In terms of hearing disability, the demographic groups most similar to Alsatians are Immigrants from Czechoslovakia (3.1%, a difference of 0.0%), Immigrants from Denmark (3.1%, a difference of 0.050%), Eastern European (3.1%, a difference of 0.070%), Immigrants from Thailand (3.1%, a difference of 0.090%), and Hispanic or Latino (3.1%, a difference of 0.13%).
| Demographics | Rating | Rank | Hearing Disability |
| Immigrants | Croatia | 20.5 /100 | #198 | Fair 3.1% |
| Syrians | 19.2 /100 | #199 | Poor 3.1% |
| Immigrants | North Macedonia | 19.1 /100 | #200 | Poor 3.1% |
| Iraqis | 19.0 /100 | #201 | Poor 3.1% |
| Immigrants | Thailand | 16.4 /100 | #202 | Poor 3.1% |
| Immigrants | Denmark | 16.2 /100 | #203 | Poor 3.1% |
| Immigrants | Czechoslovakia | 15.9 /100 | #204 | Poor 3.1% |
| Alsatians | 15.9 /100 | #205 | Poor 3.1% |
| Eastern Europeans | 15.5 /100 | #206 | Poor 3.1% |
| Hispanics or Latinos | 15.1 /100 | #207 | Poor 3.1% |
| Immigrants | Latvia | 12.7 /100 | #208 | Poor 3.1% |
| Immigrants | Hungary | 12.5 /100 | #209 | Poor 3.1% |
| Cape Verdeans | 12.2 /100 | #210 | Poor 3.1% |
| Romanians | 12.1 /100 | #211 | Poor 3.1% |
| Pakistanis | 11.1 /100 | #212 | Poor 3.1% |