Belizean vs Alsatian Hearing Disability
COMPARE
Belizean
Alsatian
Hearing Disability
Hearing Disability Comparison
Belizeans
Alsatians
2.8%
HEARING DISABILITY
96.6/ 100
METRIC RATING
89th/ 347
METRIC RANK
3.1%
HEARING DISABILITY
15.9/ 100
METRIC RATING
205th/ 347
METRIC RANK
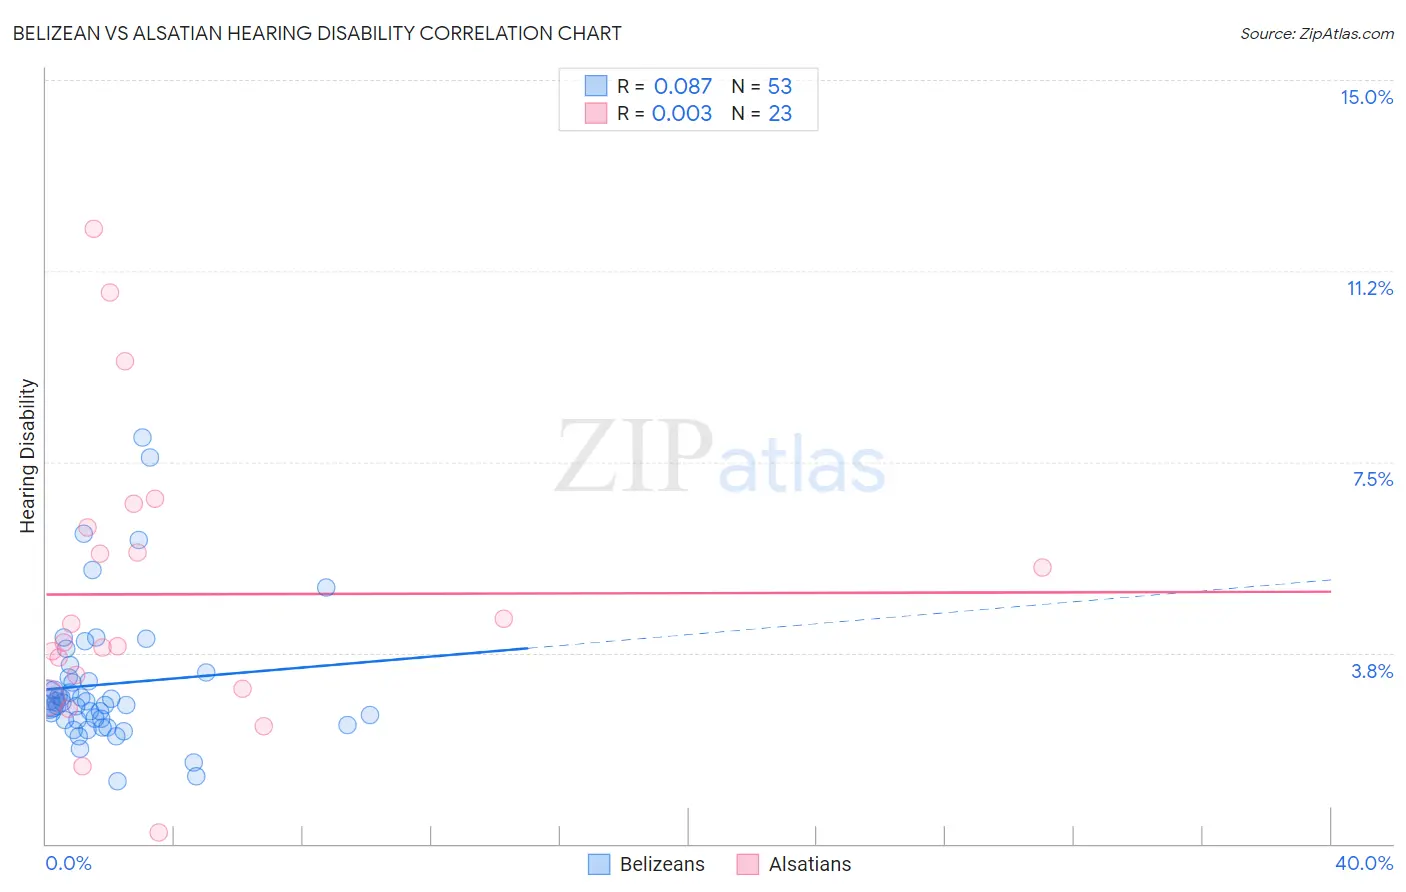
Belizean vs Alsatian Hearing Disability Correlation Chart
The statistical analysis conducted on geographies consisting of 144,164,730 people shows a slight positive correlation between the proportion of Belizeans and percentage of population with hearing disability in the United States with a correlation coefficient (R) of 0.087 and weighted average of 2.8%. Similarly, the statistical analysis conducted on geographies consisting of 82,680,655 people shows no correlation between the proportion of Alsatians and percentage of population with hearing disability in the United States with a correlation coefficient (R) of 0.003 and weighted average of 3.1%, a difference of 12.8%.
Hearing Disability Correlation Summary
| Measurement | Belizean | Alsatian |
| Minimum | 1.2% | 0.22% |
| Maximum | 8.0% | 12.1% |
| Range | 6.8% | 11.9% |
| Mean | 3.1% | 4.9% |
| Median | 2.8% | 4.0% |
| Interquartile 25% (IQ1) | 2.4% | 3.0% |
| Interquartile 75% (IQ3) | 3.3% | 6.2% |
| Interquartile Range (IQR) | 0.89% | 3.2% |
| Standard Deviation (Sample) | 1.4% | 2.8% |
| Standard Deviation (Population) | 1.3% | 2.8% |
Similar Demographics by Hearing Disability
Demographics Similar to Belizeans by Hearing Disability
In terms of hearing disability, the demographic groups most similar to Belizeans are Immigrants from Turkey (2.8%, a difference of 0.030%), Immigrants from Morocco (2.8%, a difference of 0.030%), Somali (2.8%, a difference of 0.070%), Immigrants from Middle Africa (2.8%, a difference of 0.11%), and Iranian (2.8%, a difference of 0.14%).
| Demographics | Rating | Rank | Hearing Disability |
| Immigrants | Armenia | 97.2 /100 | #82 | Exceptional 2.7% |
| Immigrants | Cuba | 97.2 /100 | #83 | Exceptional 2.7% |
| Immigrants | Argentina | 97.0 /100 | #84 | Exceptional 2.8% |
| Immigrants | Northern Africa | 96.9 /100 | #85 | Exceptional 2.8% |
| Immigrants | Iran | 96.8 /100 | #86 | Exceptional 2.8% |
| Somalis | 96.7 /100 | #87 | Exceptional 2.8% |
| Immigrants | Turkey | 96.7 /100 | #88 | Exceptional 2.8% |
| Belizeans | 96.6 /100 | #89 | Exceptional 2.8% |
| Immigrants | Morocco | 96.6 /100 | #90 | Exceptional 2.8% |
| Immigrants | Middle Africa | 96.5 /100 | #91 | Exceptional 2.8% |
| Iranians | 96.4 /100 | #92 | Exceptional 2.8% |
| Immigrants | Kuwait | 96.3 /100 | #93 | Exceptional 2.8% |
| Uruguayans | 95.9 /100 | #94 | Exceptional 2.8% |
| Israelis | 95.9 /100 | #95 | Exceptional 2.8% |
| Immigrants | Somalia | 95.5 /100 | #96 | Exceptional 2.8% |
Demographics Similar to Alsatians by Hearing Disability
In terms of hearing disability, the demographic groups most similar to Alsatians are Immigrants from Czechoslovakia (3.1%, a difference of 0.0%), Immigrants from Denmark (3.1%, a difference of 0.050%), Eastern European (3.1%, a difference of 0.070%), Immigrants from Thailand (3.1%, a difference of 0.090%), and Hispanic or Latino (3.1%, a difference of 0.13%).
| Demographics | Rating | Rank | Hearing Disability |
| Immigrants | Croatia | 20.5 /100 | #198 | Fair 3.1% |
| Syrians | 19.2 /100 | #199 | Poor 3.1% |
| Immigrants | North Macedonia | 19.1 /100 | #200 | Poor 3.1% |
| Iraqis | 19.0 /100 | #201 | Poor 3.1% |
| Immigrants | Thailand | 16.4 /100 | #202 | Poor 3.1% |
| Immigrants | Denmark | 16.2 /100 | #203 | Poor 3.1% |
| Immigrants | Czechoslovakia | 15.9 /100 | #204 | Poor 3.1% |
| Alsatians | 15.9 /100 | #205 | Poor 3.1% |
| Eastern Europeans | 15.5 /100 | #206 | Poor 3.1% |
| Hispanics or Latinos | 15.1 /100 | #207 | Poor 3.1% |
| Immigrants | Latvia | 12.7 /100 | #208 | Poor 3.1% |
| Immigrants | Hungary | 12.5 /100 | #209 | Poor 3.1% |
| Cape Verdeans | 12.2 /100 | #210 | Poor 3.1% |
| Romanians | 12.1 /100 | #211 | Poor 3.1% |
| Pakistanis | 11.1 /100 | #212 | Poor 3.1% |