Paraguayan vs Nepalese Cognitive Disability
COMPARE
Paraguayan
Nepalese
Cognitive Disability
Cognitive Disability Comparison
Paraguayans
Nepalese
16.8%
COGNITIVE DISABILITY
98.0/ 100
METRIC RATING
103rd/ 347
METRIC RANK
18.0%
COGNITIVE DISABILITY
0.3/ 100
METRIC RATING
267th/ 347
METRIC RANK
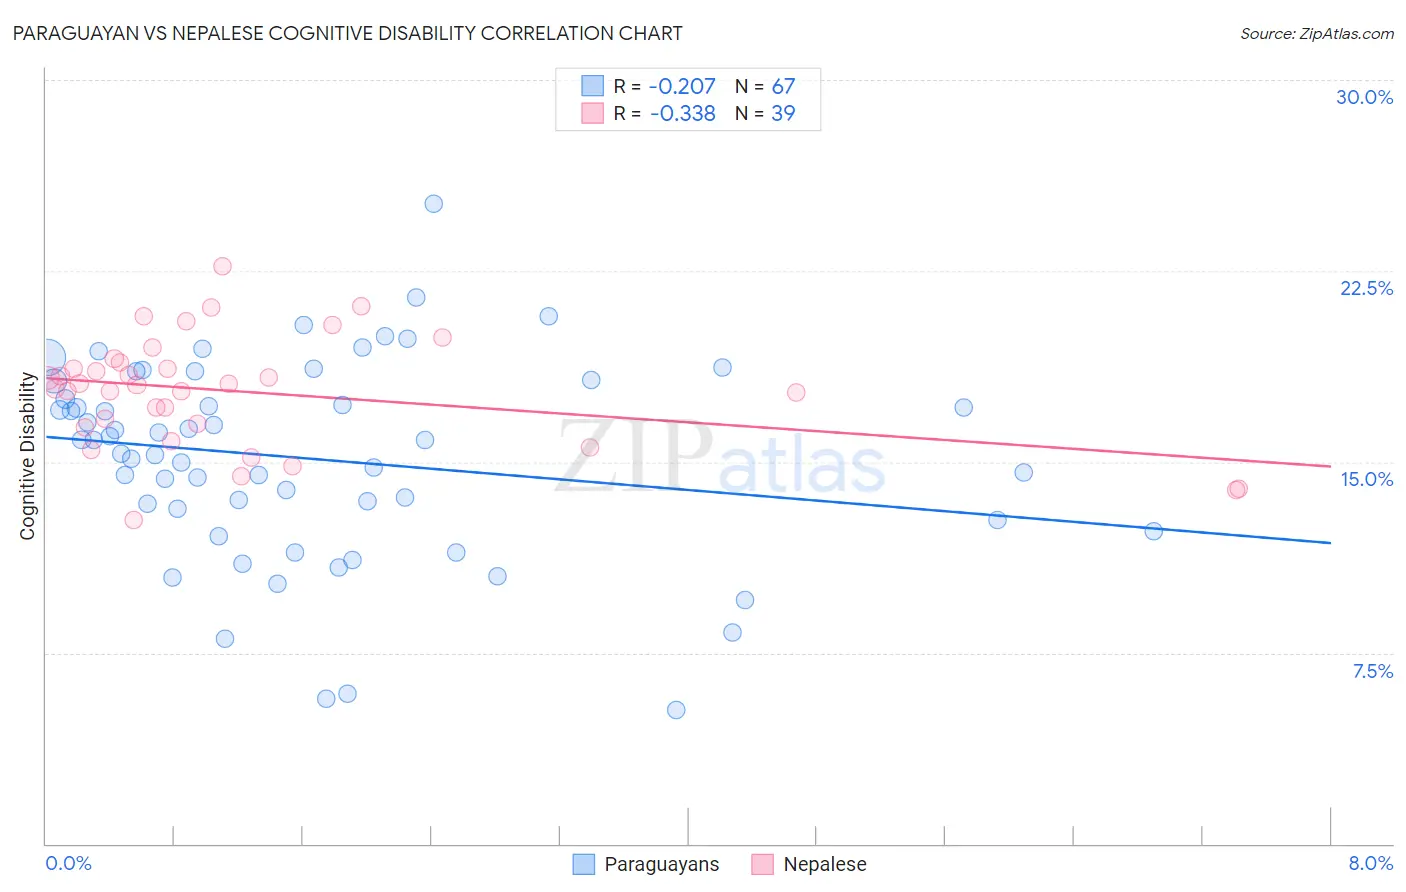
Paraguayan vs Nepalese Cognitive Disability Correlation Chart
The statistical analysis conducted on geographies consisting of 95,106,732 people shows a weak negative correlation between the proportion of Paraguayans and percentage of population with cognitive disability in the United States with a correlation coefficient (R) of -0.207 and weighted average of 16.8%. Similarly, the statistical analysis conducted on geographies consisting of 24,519,269 people shows a mild negative correlation between the proportion of Nepalese and percentage of population with cognitive disability in the United States with a correlation coefficient (R) of -0.338 and weighted average of 18.0%, a difference of 7.0%.
Cognitive Disability Correlation Summary
| Measurement | Paraguayan | Nepalese |
| Minimum | 5.3% | 12.7% |
| Maximum | 25.1% | 22.7% |
| Range | 19.9% | 10.0% |
| Mean | 15.1% | 17.7% |
| Median | 15.9% | 18.0% |
| Interquartile 25% (IQ1) | 12.7% | 16.4% |
| Interquartile 75% (IQ3) | 18.2% | 18.9% |
| Interquartile Range (IQR) | 5.4% | 2.6% |
| Standard Deviation (Sample) | 3.9% | 2.2% |
| Standard Deviation (Population) | 3.9% | 2.2% |
Similar Demographics by Cognitive Disability
Demographics Similar to Paraguayans by Cognitive Disability
In terms of cognitive disability, the demographic groups most similar to Paraguayans are Palestinian (16.8%, a difference of 0.0%), Immigrants from Eastern Asia (16.8%, a difference of 0.010%), Irish (16.8%, a difference of 0.050%), Northern European (16.8%, a difference of 0.050%), and Immigrants from Asia (16.8%, a difference of 0.070%).
| Demographics | Rating | Rank | Cognitive Disability |
| Finns | 98.5 /100 | #96 | Exceptional 16.8% |
| Dutch | 98.5 /100 | #97 | Exceptional 16.8% |
| Immigrants | Lebanon | 98.4 /100 | #98 | Exceptional 16.8% |
| Jordanians | 98.2 /100 | #99 | Exceptional 16.8% |
| Immigrants | Russia | 98.2 /100 | #100 | Exceptional 16.8% |
| Immigrants | Asia | 98.1 /100 | #101 | Exceptional 16.8% |
| Irish | 98.1 /100 | #102 | Exceptional 16.8% |
| Paraguayans | 98.0 /100 | #103 | Exceptional 16.8% |
| Palestinians | 98.0 /100 | #104 | Exceptional 16.8% |
| Immigrants | Eastern Asia | 97.9 /100 | #105 | Exceptional 16.8% |
| Northern Europeans | 97.8 /100 | #106 | Exceptional 16.8% |
| Immigrants | Nicaragua | 97.8 /100 | #107 | Exceptional 16.8% |
| Canadians | 97.5 /100 | #108 | Exceptional 16.8% |
| Albanians | 97.3 /100 | #109 | Exceptional 16.8% |
| Arapaho | 97.3 /100 | #110 | Exceptional 16.8% |
Demographics Similar to Nepalese by Cognitive Disability
In terms of cognitive disability, the demographic groups most similar to Nepalese are Cherokee (18.0%, a difference of 0.010%), Spanish American (18.0%, a difference of 0.060%), Belizean (18.0%, a difference of 0.060%), Menominee (18.0%, a difference of 0.090%), and Immigrants from Barbados (17.9%, a difference of 0.15%).
| Demographics | Rating | Rank | Cognitive Disability |
| Immigrants | Belize | 0.5 /100 | #260 | Tragic 17.9% |
| Guamanians/Chamorros | 0.5 /100 | #261 | Tragic 17.9% |
| Sierra Leoneans | 0.4 /100 | #262 | Tragic 17.9% |
| Immigrants | Barbados | 0.4 /100 | #263 | Tragic 17.9% |
| Menominee | 0.4 /100 | #264 | Tragic 18.0% |
| Spanish Americans | 0.4 /100 | #265 | Tragic 18.0% |
| Belizeans | 0.4 /100 | #266 | Tragic 18.0% |
| Nepalese | 0.3 /100 | #267 | Tragic 18.0% |
| Cherokee | 0.3 /100 | #268 | Tragic 18.0% |
| Hondurans | 0.3 /100 | #269 | Tragic 18.0% |
| Immigrants | Bahamas | 0.3 /100 | #270 | Tragic 18.0% |
| Potawatomi | 0.2 /100 | #271 | Tragic 18.0% |
| Immigrants | Honduras | 0.2 /100 | #272 | Tragic 18.0% |
| Immigrants | Nepal | 0.2 /100 | #273 | Tragic 18.0% |
| Immigrants | Nigeria | 0.2 /100 | #274 | Tragic 18.0% |