Alaska Native vs Marshallese Cognitive Disability
COMPARE
Alaska Native
Marshallese
Cognitive Disability
Cognitive Disability Comparison
Alaska Natives
Marshallese
17.5%
COGNITIVE DISABILITY
10.4/ 100
METRIC RATING
206th/ 347
METRIC RANK
17.7%
COGNITIVE DISABILITY
2.7/ 100
METRIC RATING
226th/ 347
METRIC RANK
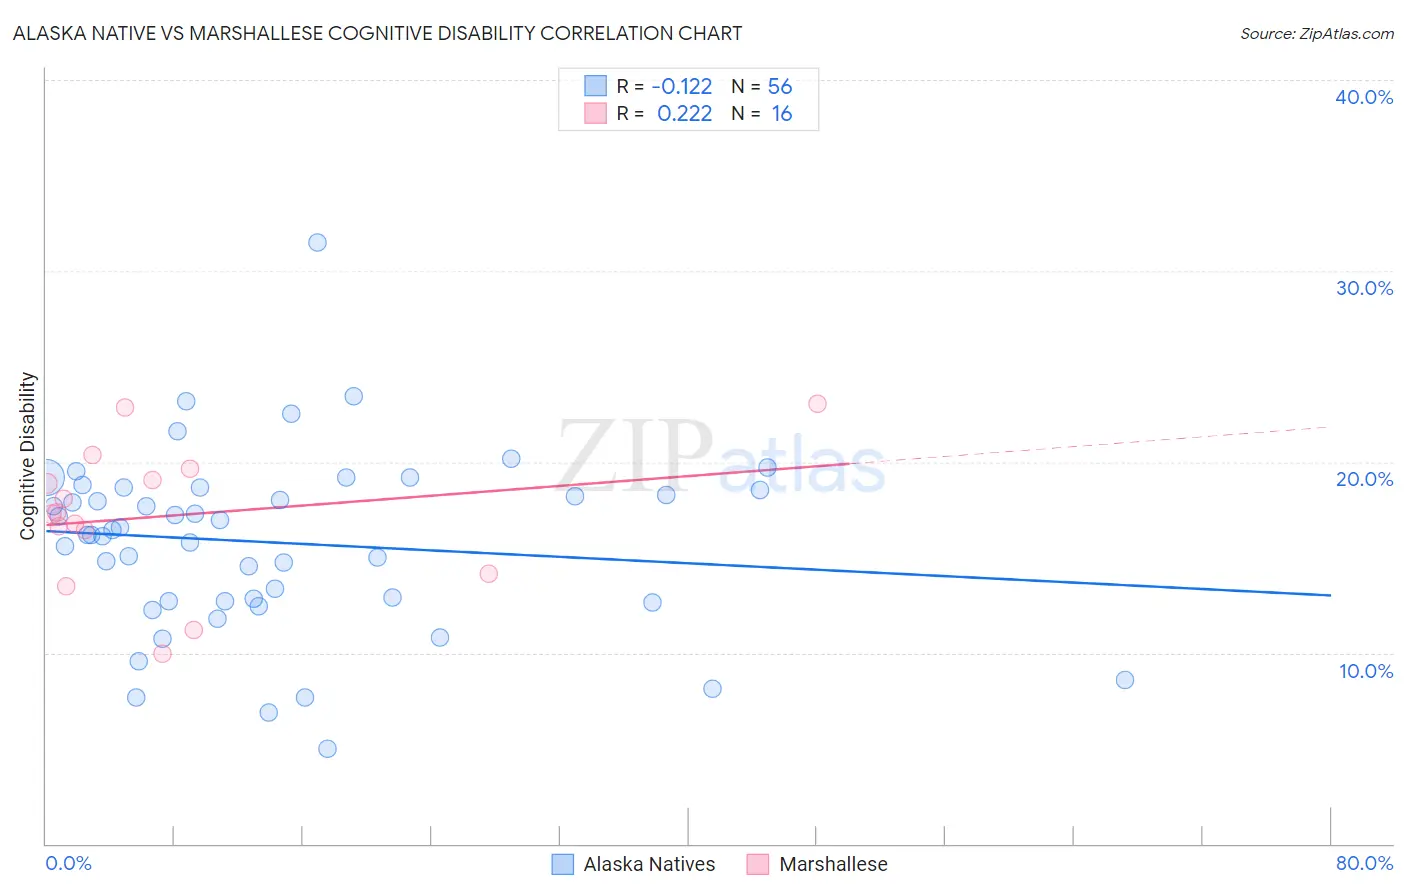
Alaska Native vs Marshallese Cognitive Disability Correlation Chart
The statistical analysis conducted on geographies consisting of 76,778,470 people shows a poor negative correlation between the proportion of Alaska Natives and percentage of population with cognitive disability in the United States with a correlation coefficient (R) of -0.122 and weighted average of 17.5%. Similarly, the statistical analysis conducted on geographies consisting of 14,761,315 people shows a weak positive correlation between the proportion of Marshallese and percentage of population with cognitive disability in the United States with a correlation coefficient (R) of 0.222 and weighted average of 17.7%, a difference of 1.0%.
Cognitive Disability Correlation Summary
| Measurement | Alaska Native | Marshallese |
| Minimum | 5.0% | 9.9% |
| Maximum | 31.5% | 23.1% |
| Range | 26.5% | 13.1% |
| Mean | 15.8% | 17.2% |
| Median | 16.3% | 17.3% |
| Interquartile 25% (IQ1) | 12.7% | 15.3% |
| Interquartile 75% (IQ3) | 18.6% | 19.3% |
| Interquartile Range (IQR) | 5.9% | 4.0% |
| Standard Deviation (Sample) | 4.7% | 3.7% |
| Standard Deviation (Population) | 4.7% | 3.6% |
Demographics Similar to Alaska Natives and Marshallese by Cognitive Disability
In terms of cognitive disability, the demographic groups most similar to Alaska Natives are Immigrants from Latin America (17.6%, a difference of 0.050%), Immigrants from Cameroon (17.6%, a difference of 0.090%), Immigrants from Trinidad and Tobago (17.6%, a difference of 0.13%), Immigrants from Jamaica (17.6%, a difference of 0.16%), and Taiwanese (17.6%, a difference of 0.23%). Similarly, the demographic groups most similar to Marshallese are Vietnamese (17.7%, a difference of 0.16%), Fijian (17.7%, a difference of 0.17%), Alsatian (17.7%, a difference of 0.36%), Central American (17.7%, a difference of 0.37%), and Moroccan (17.6%, a difference of 0.57%).
| Demographics | Rating | Rank | Cognitive Disability |
| Alaska Natives | 10.4 /100 | #206 | Poor 17.5% |
| Immigrants | Latin America | 9.7 /100 | #207 | Tragic 17.6% |
| Immigrants | Cameroon | 9.3 /100 | #208 | Tragic 17.6% |
| Immigrants | Trinidad and Tobago | 8.7 /100 | #209 | Tragic 17.6% |
| Immigrants | Jamaica | 8.5 /100 | #210 | Tragic 17.6% |
| Taiwanese | 7.7 /100 | #211 | Tragic 17.6% |
| Immigrants | Oceania | 7.3 /100 | #212 | Tragic 17.6% |
| Hawaiians | 7.2 /100 | #213 | Tragic 17.6% |
| Immigrants | El Salvador | 7.0 /100 | #214 | Tragic 17.6% |
| Alaskan Athabascans | 6.9 /100 | #215 | Tragic 17.6% |
| Okinawans | 6.8 /100 | #216 | Tragic 17.6% |
| Salvadorans | 6.7 /100 | #217 | Tragic 17.6% |
| Icelanders | 6.4 /100 | #218 | Tragic 17.6% |
| Immigrants | Sierra Leone | 6.3 /100 | #219 | Tragic 17.6% |
| Zimbabweans | 6.1 /100 | #220 | Tragic 17.6% |
| Moroccans | 5.9 /100 | #221 | Tragic 17.6% |
| Central Americans | 4.5 /100 | #222 | Tragic 17.7% |
| Alsatians | 4.5 /100 | #223 | Tragic 17.7% |
| Fijians | 3.4 /100 | #224 | Tragic 17.7% |
| Vietnamese | 3.4 /100 | #225 | Tragic 17.7% |
| Marshallese | 2.7 /100 | #226 | Tragic 17.7% |