Delaware vs Marshallese Cognitive Disability
COMPARE
Delaware
Marshallese
Cognitive Disability
Cognitive Disability Comparison
Delaware
Marshallese
17.4%
COGNITIVE DISABILITY
25.6/ 100
METRIC RATING
193rd/ 347
METRIC RANK
17.7%
COGNITIVE DISABILITY
2.7/ 100
METRIC RATING
226th/ 347
METRIC RANK
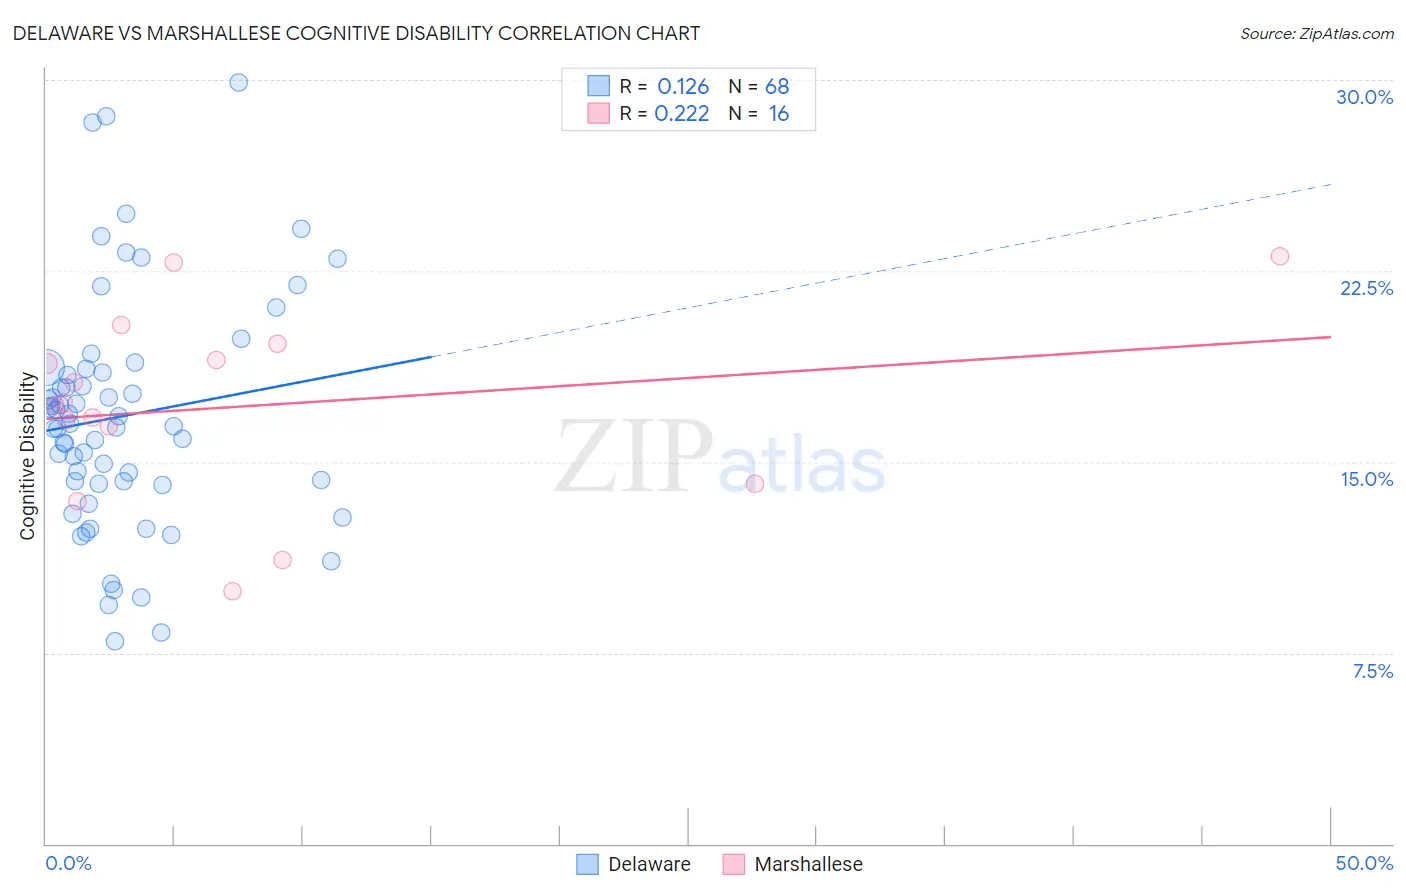
Delaware vs Marshallese Cognitive Disability Correlation Chart
The statistical analysis conducted on geographies consisting of 96,240,838 people shows a poor positive correlation between the proportion of Delaware and percentage of population with cognitive disability in the United States with a correlation coefficient (R) of 0.126 and weighted average of 17.4%. Similarly, the statistical analysis conducted on geographies consisting of 14,761,315 people shows a weak positive correlation between the proportion of Marshallese and percentage of population with cognitive disability in the United States with a correlation coefficient (R) of 0.222 and weighted average of 17.7%, a difference of 1.8%.
Cognitive Disability Correlation Summary
| Measurement | Delaware | Marshallese |
| Minimum | 8.0% | 9.9% |
| Maximum | 29.9% | 23.1% |
| Range | 21.9% | 13.1% |
| Mean | 16.8% | 17.2% |
| Median | 16.5% | 17.3% |
| Interquartile 25% (IQ1) | 14.2% | 15.3% |
| Interquartile 75% (IQ3) | 18.6% | 19.3% |
| Interquartile Range (IQR) | 4.4% | 4.0% |
| Standard Deviation (Sample) | 4.6% | 3.7% |
| Standard Deviation (Population) | 4.6% | 3.6% |
Similar Demographics by Cognitive Disability
Demographics Similar to Delaware by Cognitive Disability
In terms of cognitive disability, the demographic groups most similar to Delaware are Immigrants from Haiti (17.4%, a difference of 0.050%), Nonimmigrants (17.4%, a difference of 0.060%), Immigrants from Spain (17.4%, a difference of 0.070%), Immigrants from Western Asia (17.4%, a difference of 0.14%), and Immigrants from Bosnia and Herzegovina (17.4%, a difference of 0.14%).
| Demographics | Rating | Rank | Cognitive Disability |
| Cambodians | 35.9 /100 | #186 | Fair 17.3% |
| Immigrants | Fiji | 33.7 /100 | #187 | Fair 17.4% |
| Immigrants | France | 29.8 /100 | #188 | Fair 17.4% |
| Immigrants | Western Asia | 29.5 /100 | #189 | Fair 17.4% |
| Immigrants | Spain | 27.7 /100 | #190 | Fair 17.4% |
| Immigrants | Nonimmigrants | 27.4 /100 | #191 | Fair 17.4% |
| Immigrants | Haiti | 27.1 /100 | #192 | Fair 17.4% |
| Delaware | 25.6 /100 | #193 | Fair 17.4% |
| Immigrants | Bosnia and Herzegovina | 22.0 /100 | #194 | Fair 17.4% |
| New Zealanders | 21.1 /100 | #195 | Fair 17.4% |
| Guyanese | 17.5 /100 | #196 | Poor 17.5% |
| Immigrants | Afghanistan | 16.7 /100 | #197 | Poor 17.5% |
| Immigrants | Panama | 14.8 /100 | #198 | Poor 17.5% |
| Immigrants | Singapore | 14.3 /100 | #199 | Poor 17.5% |
| Haitians | 14.1 /100 | #200 | Poor 17.5% |
Demographics Similar to Marshallese by Cognitive Disability
In terms of cognitive disability, the demographic groups most similar to Marshallese are Immigrants from St. Vincent and the Grenadines (17.7%, a difference of 0.030%), Immigrants from Central America (17.7%, a difference of 0.11%), Immigrants from Guatemala (17.7%, a difference of 0.13%), Vietnamese (17.7%, a difference of 0.16%), and Mongolian (17.7%, a difference of 0.16%).
| Demographics | Rating | Rank | Cognitive Disability |
| Immigrants | Sierra Leone | 6.3 /100 | #219 | Tragic 17.6% |
| Zimbabweans | 6.1 /100 | #220 | Tragic 17.6% |
| Moroccans | 5.9 /100 | #221 | Tragic 17.6% |
| Central Americans | 4.5 /100 | #222 | Tragic 17.7% |
| Alsatians | 4.5 /100 | #223 | Tragic 17.7% |
| Fijians | 3.4 /100 | #224 | Tragic 17.7% |
| Vietnamese | 3.4 /100 | #225 | Tragic 17.7% |
| Marshallese | 2.7 /100 | #226 | Tragic 17.7% |
| Immigrants | St. Vincent and the Grenadines | 2.6 /100 | #227 | Tragic 17.7% |
| Immigrants | Central America | 2.3 /100 | #228 | Tragic 17.7% |
| Immigrants | Guatemala | 2.2 /100 | #229 | Tragic 17.7% |
| Mongolians | 2.2 /100 | #230 | Tragic 17.7% |
| Guatemalans | 2.1 /100 | #231 | Tragic 17.8% |
| Tongans | 2.1 /100 | #232 | Tragic 17.8% |
| Panamanians | 2.1 /100 | #233 | Tragic 17.8% |