Romanian vs Marshallese Cognitive Disability
COMPARE
Romanian
Marshallese
Cognitive Disability
Cognitive Disability Comparison
Romanians
Marshallese
16.6%
COGNITIVE DISABILITY
99.7/ 100
METRIC RATING
60th/ 347
METRIC RANK
17.7%
COGNITIVE DISABILITY
2.7/ 100
METRIC RATING
226th/ 347
METRIC RANK
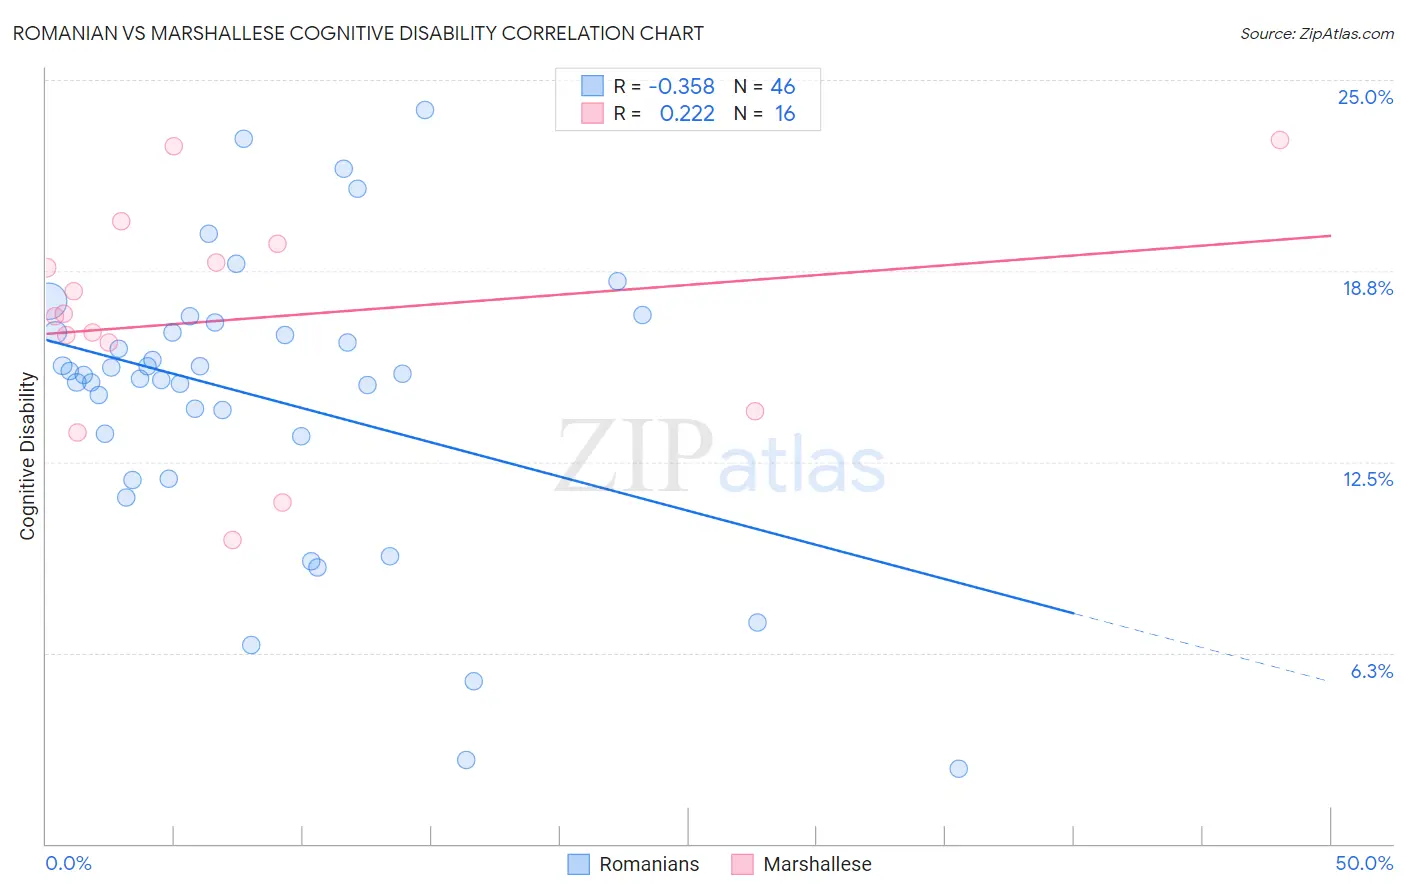
Romanian vs Marshallese Cognitive Disability Correlation Chart
The statistical analysis conducted on geographies consisting of 377,876,642 people shows a mild negative correlation between the proportion of Romanians and percentage of population with cognitive disability in the United States with a correlation coefficient (R) of -0.358 and weighted average of 16.6%. Similarly, the statistical analysis conducted on geographies consisting of 14,761,315 people shows a weak positive correlation between the proportion of Marshallese and percentage of population with cognitive disability in the United States with a correlation coefficient (R) of 0.222 and weighted average of 17.7%, a difference of 6.9%.
Cognitive Disability Correlation Summary
| Measurement | Romanian | Marshallese |
| Minimum | 2.4% | 9.9% |
| Maximum | 24.0% | 23.1% |
| Range | 21.6% | 13.1% |
| Mean | 14.6% | 17.2% |
| Median | 15.4% | 17.3% |
| Interquartile 25% (IQ1) | 13.3% | 15.3% |
| Interquartile 75% (IQ3) | 16.7% | 19.3% |
| Interquartile Range (IQR) | 3.4% | 4.0% |
| Standard Deviation (Sample) | 4.7% | 3.7% |
| Standard Deviation (Population) | 4.6% | 3.6% |
Similar Demographics by Cognitive Disability
Demographics Similar to Romanians by Cognitive Disability
In terms of cognitive disability, the demographic groups most similar to Romanians are Pennsylvania German (16.6%, a difference of 0.010%), Immigrants from Peru (16.6%, a difference of 0.010%), Immigrants from England (16.6%, a difference of 0.060%), Austrian (16.6%, a difference of 0.090%), and Bhutanese (16.6%, a difference of 0.090%).
| Demographics | Rating | Rank | Cognitive Disability |
| Swedes | 99.8 /100 | #53 | Exceptional 16.5% |
| Immigrants | Iran | 99.8 /100 | #54 | Exceptional 16.5% |
| Immigrants | Venezuela | 99.7 /100 | #55 | Exceptional 16.5% |
| Austrians | 99.7 /100 | #56 | Exceptional 16.6% |
| Bhutanese | 99.7 /100 | #57 | Exceptional 16.6% |
| Pennsylvania Germans | 99.7 /100 | #58 | Exceptional 16.6% |
| Immigrants | Peru | 99.7 /100 | #59 | Exceptional 16.6% |
| Romanians | 99.7 /100 | #60 | Exceptional 16.6% |
| Immigrants | England | 99.6 /100 | #61 | Exceptional 16.6% |
| Czechoslovakians | 99.6 /100 | #62 | Exceptional 16.6% |
| Argentineans | 99.6 /100 | #63 | Exceptional 16.6% |
| Venezuelans | 99.6 /100 | #64 | Exceptional 16.6% |
| Colombians | 99.6 /100 | #65 | Exceptional 16.6% |
| Immigrants | Ukraine | 99.5 /100 | #66 | Exceptional 16.6% |
| Latvians | 99.5 /100 | #67 | Exceptional 16.6% |
Demographics Similar to Marshallese by Cognitive Disability
In terms of cognitive disability, the demographic groups most similar to Marshallese are Immigrants from St. Vincent and the Grenadines (17.7%, a difference of 0.030%), Immigrants from Central America (17.7%, a difference of 0.11%), Immigrants from Guatemala (17.7%, a difference of 0.13%), Vietnamese (17.7%, a difference of 0.16%), and Mongolian (17.7%, a difference of 0.16%).
| Demographics | Rating | Rank | Cognitive Disability |
| Immigrants | Sierra Leone | 6.3 /100 | #219 | Tragic 17.6% |
| Zimbabweans | 6.1 /100 | #220 | Tragic 17.6% |
| Moroccans | 5.9 /100 | #221 | Tragic 17.6% |
| Central Americans | 4.5 /100 | #222 | Tragic 17.7% |
| Alsatians | 4.5 /100 | #223 | Tragic 17.7% |
| Fijians | 3.4 /100 | #224 | Tragic 17.7% |
| Vietnamese | 3.4 /100 | #225 | Tragic 17.7% |
| Marshallese | 2.7 /100 | #226 | Tragic 17.7% |
| Immigrants | St. Vincent and the Grenadines | 2.6 /100 | #227 | Tragic 17.7% |
| Immigrants | Central America | 2.3 /100 | #228 | Tragic 17.7% |
| Immigrants | Guatemala | 2.2 /100 | #229 | Tragic 17.7% |
| Mongolians | 2.2 /100 | #230 | Tragic 17.7% |
| Guatemalans | 2.1 /100 | #231 | Tragic 17.8% |
| Tongans | 2.1 /100 | #232 | Tragic 17.8% |
| Panamanians | 2.1 /100 | #233 | Tragic 17.8% |