Chippewa vs Cuban Male Disability
COMPARE
Chippewa
Cuban
Male Disability
Male Disability Comparison
Chippewa
Cubans
14.3%
MALE DISABILITY
0.0/ 100
METRIC RATING
328th/ 347
METRIC RANK
11.0%
MALE DISABILITY
74.9/ 100
METRIC RATING
151st/ 347
METRIC RANK
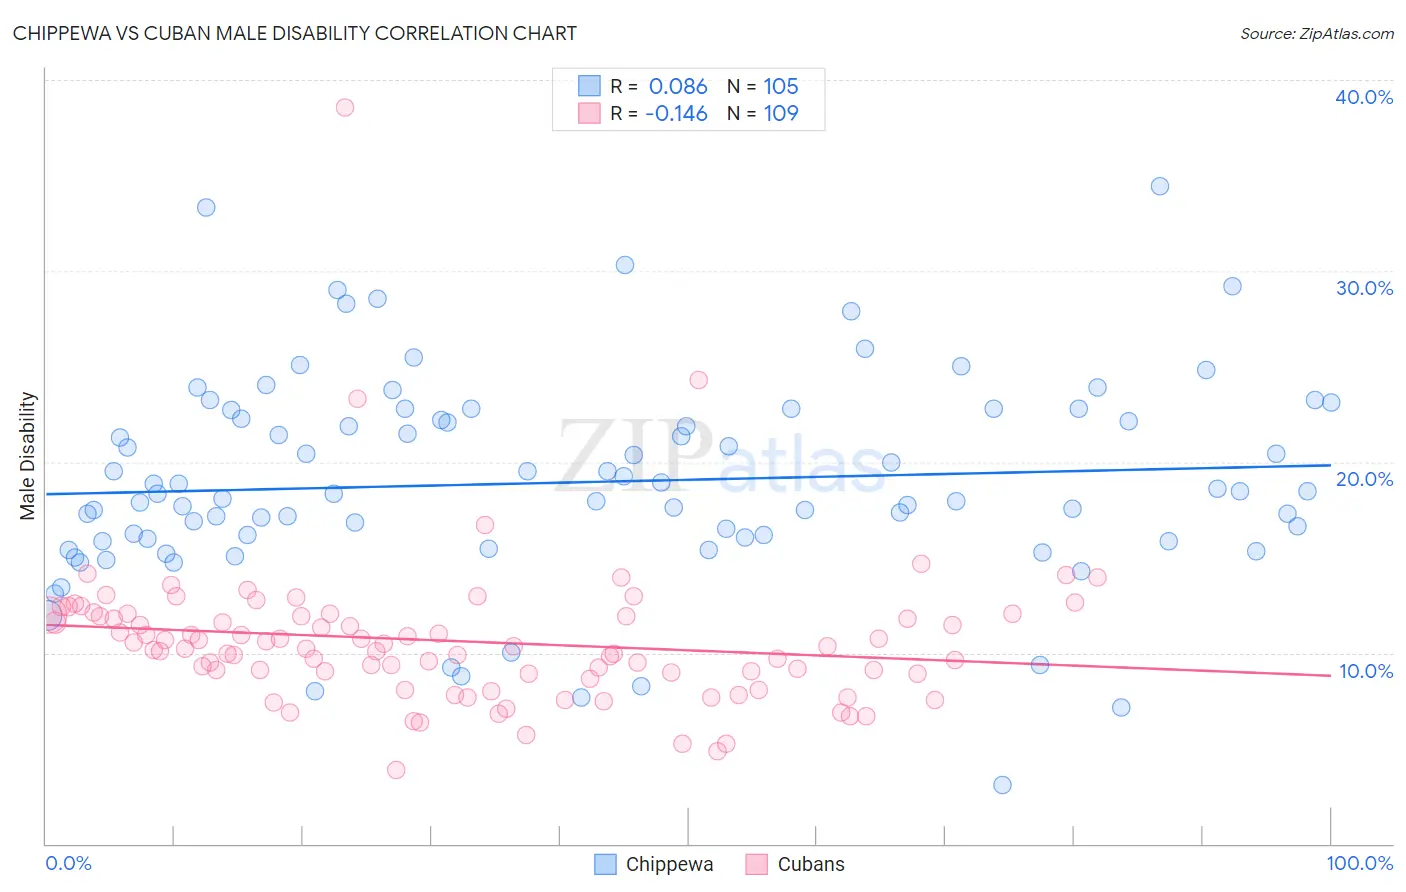
Chippewa vs Cuban Male Disability Correlation Chart
The statistical analysis conducted on geographies consisting of 215,038,110 people shows a slight positive correlation between the proportion of Chippewa and percentage of males with a disability in the United States with a correlation coefficient (R) of 0.086 and weighted average of 14.3%. Similarly, the statistical analysis conducted on geographies consisting of 449,227,297 people shows a poor negative correlation between the proportion of Cubans and percentage of males with a disability in the United States with a correlation coefficient (R) of -0.146 and weighted average of 11.0%, a difference of 29.3%.
Male Disability Correlation Summary
| Measurement | Chippewa | Cuban |
| Minimum | 3.1% | 3.9% |
| Maximum | 34.5% | 38.6% |
| Range | 31.4% | 34.7% |
| Mean | 18.9% | 10.6% |
| Median | 18.3% | 10.2% |
| Interquartile 25% (IQ1) | 15.9% | 8.9% |
| Interquartile 75% (IQ3) | 22.5% | 11.9% |
| Interquartile Range (IQR) | 6.6% | 3.0% |
| Standard Deviation (Sample) | 5.5% | 4.0% |
| Standard Deviation (Population) | 5.4% | 4.0% |
Similar Demographics by Male Disability
Demographics Similar to Chippewa by Male Disability
In terms of male disability, the demographic groups most similar to Chippewa are Potawatomi (14.2%, a difference of 0.43%), Native/Alaskan (14.2%, a difference of 0.53%), Cajun (14.4%, a difference of 0.57%), Navajo (14.4%, a difference of 0.81%), and Ottawa (14.1%, a difference of 1.5%).
| Demographics | Rating | Rank | Male Disability |
| Shoshone | 0.0 /100 | #321 | Tragic 13.8% |
| Apache | 0.0 /100 | #322 | Tragic 14.0% |
| Osage | 0.0 /100 | #323 | Tragic 14.0% |
| Comanche | 0.0 /100 | #324 | Tragic 14.1% |
| Ottawa | 0.0 /100 | #325 | Tragic 14.1% |
| Natives/Alaskans | 0.0 /100 | #326 | Tragic 14.2% |
| Potawatomi | 0.0 /100 | #327 | Tragic 14.2% |
| Chippewa | 0.0 /100 | #328 | Tragic 14.3% |
| Cajuns | 0.0 /100 | #329 | Tragic 14.4% |
| Navajo | 0.0 /100 | #330 | Tragic 14.4% |
| Tohono O'odham | 0.0 /100 | #331 | Tragic 14.6% |
| Seminole | 0.0 /100 | #332 | Tragic 14.7% |
| Yuman | 0.0 /100 | #333 | Tragic 14.7% |
| Cherokee | 0.0 /100 | #334 | Tragic 14.8% |
| Dutch West Indians | 0.0 /100 | #335 | Tragic 14.8% |
Demographics Similar to Cubans by Male Disability
In terms of male disability, the demographic groups most similar to Cubans are Immigrants from Guatemala (11.0%, a difference of 0.020%), Immigrants from Albania (11.0%, a difference of 0.030%), Immigrants from Denmark (11.0%, a difference of 0.12%), Immigrants from Northern Europe (11.1%, a difference of 0.12%), and Immigrants from Moldova (11.1%, a difference of 0.15%).
| Demographics | Rating | Rank | Male Disability |
| Kenyans | 78.1 /100 | #144 | Good 11.0% |
| Costa Ricans | 78.0 /100 | #145 | Good 11.0% |
| Koreans | 77.5 /100 | #146 | Good 11.0% |
| Immigrants | Croatia | 77.3 /100 | #147 | Good 11.0% |
| Sudanese | 77.1 /100 | #148 | Good 11.0% |
| Immigrants | Denmark | 76.4 /100 | #149 | Good 11.0% |
| Immigrants | Guatemala | 75.1 /100 | #150 | Good 11.0% |
| Cubans | 74.9 /100 | #151 | Good 11.0% |
| Immigrants | Albania | 74.4 /100 | #152 | Good 11.0% |
| Immigrants | Northern Europe | 73.2 /100 | #153 | Good 11.1% |
| Immigrants | Moldova | 72.8 /100 | #154 | Good 11.1% |
| Immigrants | Middle Africa | 70.9 /100 | #155 | Good 11.1% |
| Russians | 69.8 /100 | #156 | Good 11.1% |
| Immigrants | Western Africa | 69.2 /100 | #157 | Good 11.1% |
| Latvians | 68.1 /100 | #158 | Good 11.1% |