Seminole vs Immigrants from El Salvador Female Disability
COMPARE
Seminole
Immigrants from El Salvador
Female Disability
Female Disability Comparison
Seminole
Immigrants from El Salvador
15.0%
FEMALE DISABILITY
0.0/ 100
METRIC RATING
336th/ 347
METRIC RANK
11.4%
FEMALE DISABILITY
99.9/ 100
METRIC RATING
64th/ 347
METRIC RANK
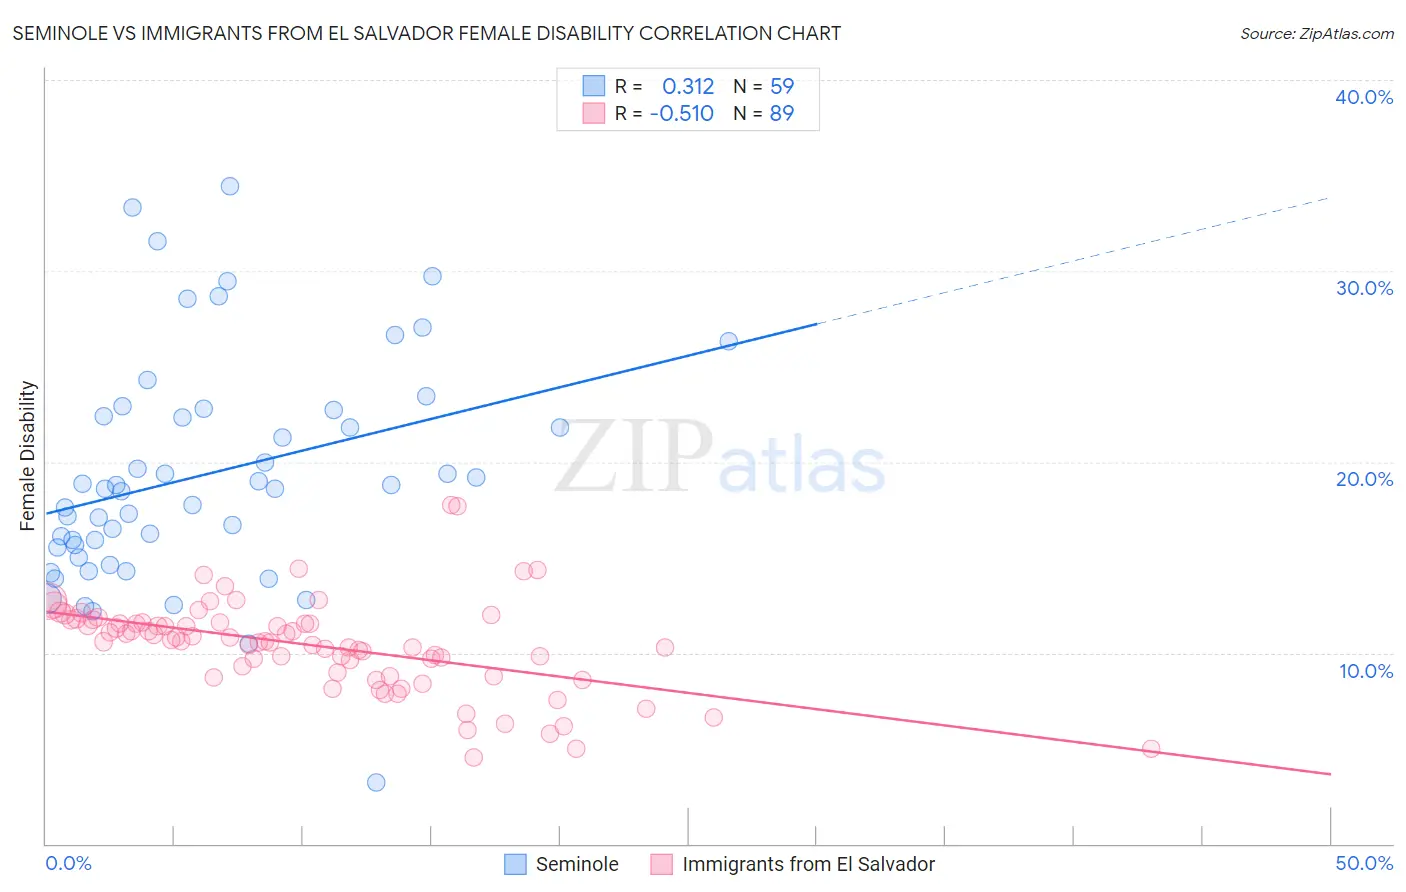
Seminole vs Immigrants from El Salvador Female Disability Correlation Chart
The statistical analysis conducted on geographies consisting of 118,309,192 people shows a mild positive correlation between the proportion of Seminole and percentage of females with a disability in the United States with a correlation coefficient (R) of 0.312 and weighted average of 15.0%. Similarly, the statistical analysis conducted on geographies consisting of 357,763,756 people shows a substantial negative correlation between the proportion of Immigrants from El Salvador and percentage of females with a disability in the United States with a correlation coefficient (R) of -0.510 and weighted average of 11.4%, a difference of 30.9%.
Female Disability Correlation Summary
| Measurement | Seminole | Immigrants from El Salvador |
| Minimum | 3.2% | 4.5% |
| Maximum | 34.4% | 17.7% |
| Range | 31.3% | 13.2% |
| Mean | 19.4% | 10.4% |
| Median | 18.6% | 10.6% |
| Interquartile 25% (IQ1) | 15.5% | 8.9% |
| Interquartile 75% (IQ3) | 22.7% | 11.6% |
| Interquartile Range (IQR) | 7.2% | 2.7% |
| Standard Deviation (Sample) | 6.0% | 2.4% |
| Standard Deviation (Population) | 6.0% | 2.4% |
Similar Demographics by Female Disability
Demographics Similar to Seminole by Female Disability
In terms of female disability, the demographic groups most similar to Seminole are Tohono O'odham (15.0%, a difference of 0.12%), Dutch West Indian (15.0%, a difference of 0.26%), Cajun (14.9%, a difference of 0.67%), Colville (15.1%, a difference of 0.67%), and Cherokee (14.9%, a difference of 0.69%).
| Demographics | Rating | Rank | Female Disability |
| Osage | 0.0 /100 | #329 | Tragic 14.3% |
| Yuman | 0.0 /100 | #330 | Tragic 14.5% |
| Immigrants | Cabo Verde | 0.0 /100 | #331 | Tragic 14.6% |
| Pima | 0.0 /100 | #332 | Tragic 14.8% |
| Immigrants | Azores | 0.0 /100 | #333 | Tragic 14.9% |
| Cherokee | 0.0 /100 | #334 | Tragic 14.9% |
| Cajuns | 0.0 /100 | #335 | Tragic 14.9% |
| Seminole | 0.0 /100 | #336 | Tragic 15.0% |
| Tohono O'odham | 0.0 /100 | #337 | Tragic 15.0% |
| Dutch West Indians | 0.0 /100 | #338 | Tragic 15.0% |
| Colville | 0.0 /100 | #339 | Tragic 15.1% |
| Chickasaw | 0.0 /100 | #340 | Tragic 15.2% |
| Choctaw | 0.0 /100 | #341 | Tragic 15.4% |
| Creek | 0.0 /100 | #342 | Tragic 15.7% |
| Lumbee | 0.0 /100 | #343 | Tragic 15.8% |
Demographics Similar to Immigrants from El Salvador by Female Disability
In terms of female disability, the demographic groups most similar to Immigrants from El Salvador are Immigrants from South America (11.4%, a difference of 0.020%), Immigrants from Colombia (11.4%, a difference of 0.070%), Sri Lankan (11.4%, a difference of 0.17%), Salvadoran (11.5%, a difference of 0.19%), and Immigrants from Vietnam (11.5%, a difference of 0.24%).
| Demographics | Rating | Rank | Female Disability |
| South Americans | 99.9 /100 | #57 | Exceptional 11.4% |
| Laotians | 99.9 /100 | #58 | Exceptional 11.4% |
| Immigrants | Spain | 99.9 /100 | #59 | Exceptional 11.4% |
| Immigrants | Bulgaria | 99.9 /100 | #60 | Exceptional 11.4% |
| Immigrants | France | 99.9 /100 | #61 | Exceptional 11.4% |
| Sri Lankans | 99.9 /100 | #62 | Exceptional 11.4% |
| Immigrants | Colombia | 99.9 /100 | #63 | Exceptional 11.4% |
| Immigrants | El Salvador | 99.9 /100 | #64 | Exceptional 11.4% |
| Immigrants | South America | 99.9 /100 | #65 | Exceptional 11.4% |
| Salvadorans | 99.8 /100 | #66 | Exceptional 11.5% |
| Immigrants | Vietnam | 99.8 /100 | #67 | Exceptional 11.5% |
| Immigrants | Northern Africa | 99.8 /100 | #68 | Exceptional 11.5% |
| Colombians | 99.8 /100 | #69 | Exceptional 11.5% |
| Immigrants | Chile | 99.8 /100 | #70 | Exceptional 11.5% |
| Immigrants | Ireland | 99.8 /100 | #71 | Exceptional 11.5% |