West Indian vs Immigrants from El Salvador Female Disability
COMPARE
West Indian
Immigrants from El Salvador
Female Disability
Female Disability Comparison
West Indians
Immigrants from El Salvador
12.8%
FEMALE DISABILITY
0.5/ 100
METRIC RATING
265th/ 347
METRIC RANK
11.4%
FEMALE DISABILITY
99.9/ 100
METRIC RATING
64th/ 347
METRIC RANK
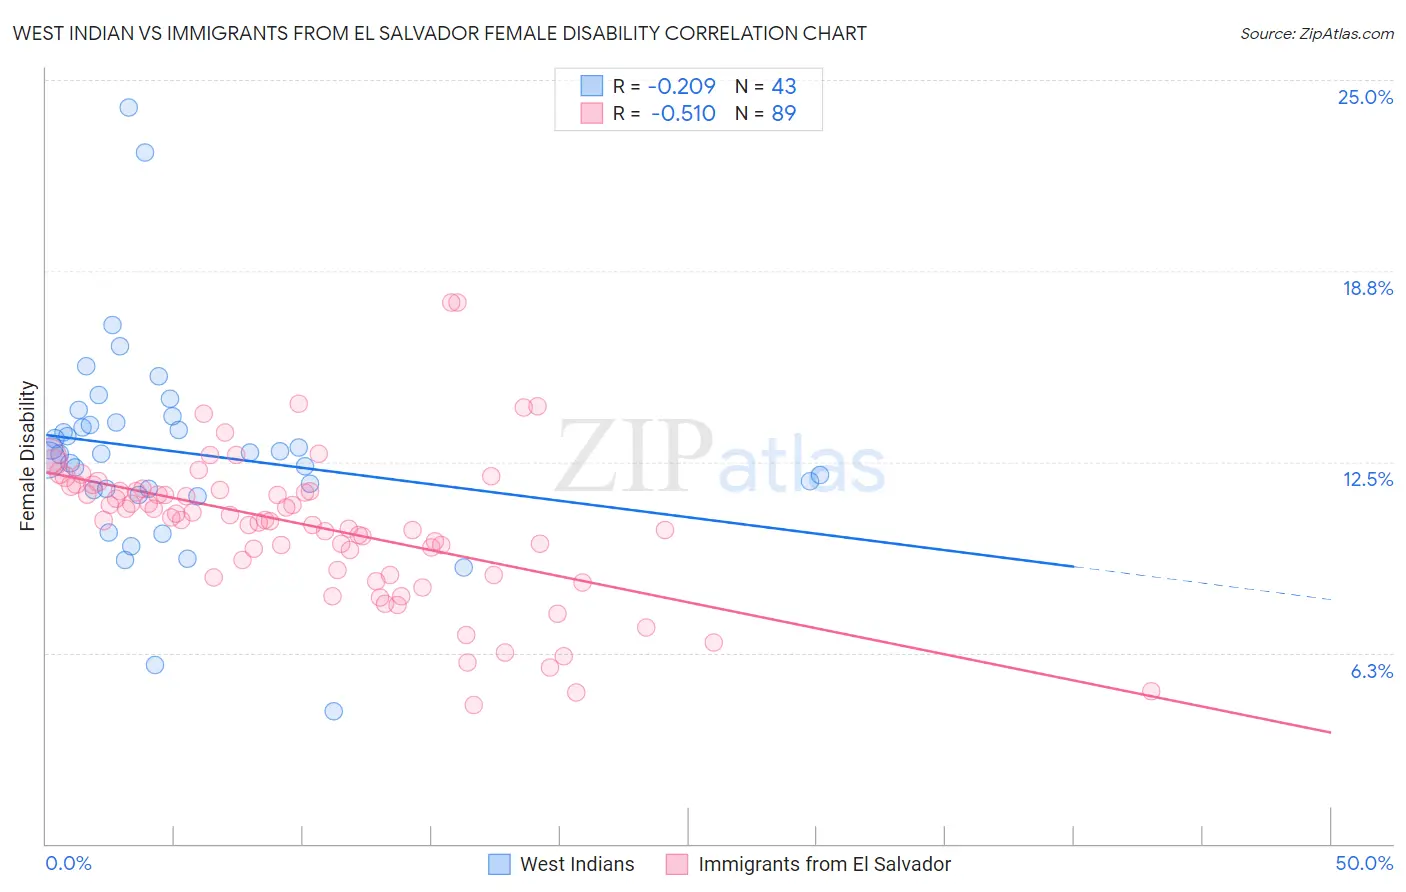
West Indian vs Immigrants from El Salvador Female Disability Correlation Chart
The statistical analysis conducted on geographies consisting of 254,014,904 people shows a weak negative correlation between the proportion of West Indians and percentage of females with a disability in the United States with a correlation coefficient (R) of -0.209 and weighted average of 12.8%. Similarly, the statistical analysis conducted on geographies consisting of 357,763,756 people shows a substantial negative correlation between the proportion of Immigrants from El Salvador and percentage of females with a disability in the United States with a correlation coefficient (R) of -0.510 and weighted average of 11.4%, a difference of 11.9%.
Female Disability Correlation Summary
| Measurement | West Indian | Immigrants from El Salvador |
| Minimum | 4.3% | 4.5% |
| Maximum | 24.1% | 17.7% |
| Range | 19.8% | 13.2% |
| Mean | 12.8% | 10.4% |
| Median | 12.8% | 10.6% |
| Interquartile 25% (IQ1) | 11.6% | 8.9% |
| Interquartile 75% (IQ3) | 13.8% | 11.6% |
| Interquartile Range (IQR) | 2.2% | 2.7% |
| Standard Deviation (Sample) | 3.4% | 2.4% |
| Standard Deviation (Population) | 3.3% | 2.4% |
Similar Demographics by Female Disability
Demographics Similar to West Indians by Female Disability
In terms of female disability, the demographic groups most similar to West Indians are Finnish (12.8%, a difference of 0.12%), Senegalese (12.8%, a difference of 0.13%), Immigrants from Laos (12.8%, a difference of 0.16%), Alaska Native (12.8%, a difference of 0.19%), and Indonesian (12.8%, a difference of 0.22%).
| Demographics | Rating | Rank | Female Disability |
| Aleuts | 1.1 /100 | #258 | Tragic 12.7% |
| Immigrants | Armenia | 1.0 /100 | #259 | Tragic 12.7% |
| Sub-Saharan Africans | 1.0 /100 | #260 | Tragic 12.7% |
| Bermudans | 1.0 /100 | #261 | Tragic 12.7% |
| Czechoslovakians | 0.9 /100 | #262 | Tragic 12.7% |
| Spaniards | 0.7 /100 | #263 | Tragic 12.8% |
| Alaska Natives | 0.6 /100 | #264 | Tragic 12.8% |
| West Indians | 0.5 /100 | #265 | Tragic 12.8% |
| Finns | 0.4 /100 | #266 | Tragic 12.8% |
| Senegalese | 0.4 /100 | #267 | Tragic 12.8% |
| Immigrants | Laos | 0.4 /100 | #268 | Tragic 12.8% |
| Indonesians | 0.4 /100 | #269 | Tragic 12.8% |
| Immigrants | Liberia | 0.3 /100 | #270 | Tragic 12.9% |
| Dutch | 0.2 /100 | #271 | Tragic 12.9% |
| Germans | 0.1 /100 | #272 | Tragic 12.9% |
Demographics Similar to Immigrants from El Salvador by Female Disability
In terms of female disability, the demographic groups most similar to Immigrants from El Salvador are Immigrants from South America (11.4%, a difference of 0.020%), Immigrants from Colombia (11.4%, a difference of 0.070%), Sri Lankan (11.4%, a difference of 0.17%), Salvadoran (11.5%, a difference of 0.19%), and Immigrants from Vietnam (11.5%, a difference of 0.24%).
| Demographics | Rating | Rank | Female Disability |
| South Americans | 99.9 /100 | #57 | Exceptional 11.4% |
| Laotians | 99.9 /100 | #58 | Exceptional 11.4% |
| Immigrants | Spain | 99.9 /100 | #59 | Exceptional 11.4% |
| Immigrants | Bulgaria | 99.9 /100 | #60 | Exceptional 11.4% |
| Immigrants | France | 99.9 /100 | #61 | Exceptional 11.4% |
| Sri Lankans | 99.9 /100 | #62 | Exceptional 11.4% |
| Immigrants | Colombia | 99.9 /100 | #63 | Exceptional 11.4% |
| Immigrants | El Salvador | 99.9 /100 | #64 | Exceptional 11.4% |
| Immigrants | South America | 99.9 /100 | #65 | Exceptional 11.4% |
| Salvadorans | 99.8 /100 | #66 | Exceptional 11.5% |
| Immigrants | Vietnam | 99.8 /100 | #67 | Exceptional 11.5% |
| Immigrants | Northern Africa | 99.8 /100 | #68 | Exceptional 11.5% |
| Colombians | 99.8 /100 | #69 | Exceptional 11.5% |
| Immigrants | Chile | 99.8 /100 | #70 | Exceptional 11.5% |
| Immigrants | Ireland | 99.8 /100 | #71 | Exceptional 11.5% |