Chinese vs Immigrants from Trinidad and Tobago Female Disability
COMPARE
Chinese
Immigrants from Trinidad and Tobago
Female Disability
Female Disability Comparison
Chinese
Immigrants from Trinidad and Tobago
12.3%
FEMALE DISABILITY
22.1/ 100
METRIC RATING
201st/ 347
METRIC RANK
12.3%
FEMALE DISABILITY
24.7/ 100
METRIC RATING
199th/ 347
METRIC RANK
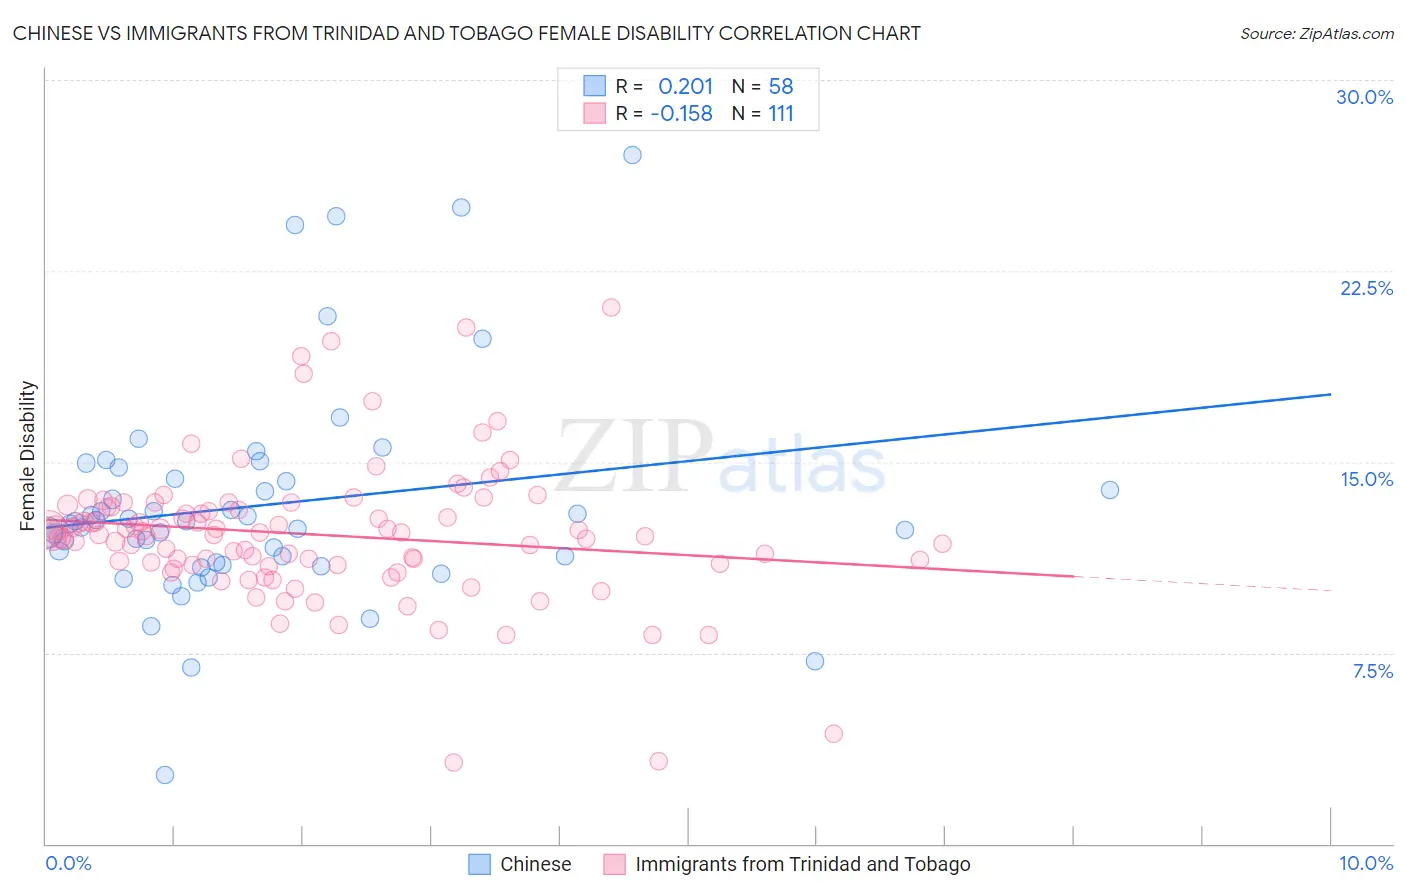
Chinese vs Immigrants from Trinidad and Tobago Female Disability Correlation Chart
The statistical analysis conducted on geographies consisting of 64,802,500 people shows a weak positive correlation between the proportion of Chinese and percentage of females with a disability in the United States with a correlation coefficient (R) of 0.201 and weighted average of 12.3%. Similarly, the statistical analysis conducted on geographies consisting of 223,503,313 people shows a poor negative correlation between the proportion of Immigrants from Trinidad and Tobago and percentage of females with a disability in the United States with a correlation coefficient (R) of -0.158 and weighted average of 12.3%, a difference of 0.13%.
Female Disability Correlation Summary
| Measurement | Chinese | Immigrants from Trinidad and Tobago |
| Minimum | 2.7% | 3.2% |
| Maximum | 27.1% | 21.1% |
| Range | 24.4% | 17.9% |
| Mean | 13.3% | 12.1% |
| Median | 12.6% | 12.1% |
| Interquartile 25% (IQ1) | 11.1% | 11.0% |
| Interquartile 75% (IQ3) | 14.3% | 13.2% |
| Interquartile Range (IQR) | 3.3% | 2.3% |
| Standard Deviation (Sample) | 4.3% | 2.8% |
| Standard Deviation (Population) | 4.3% | 2.7% |
Demographics Similar to Chinese and Immigrants from Trinidad and Tobago by Female Disability
In terms of female disability, the demographic groups most similar to Chinese are Trinidadian and Tobagonian (12.3%, a difference of 0.010%), Somali (12.3%, a difference of 0.030%), Immigrants from Barbados (12.3%, a difference of 0.050%), Immigrants from Zaire (12.3%, a difference of 0.070%), and Immigrants from Grenada (12.4%, a difference of 0.090%). Similarly, the demographic groups most similar to Immigrants from Trinidad and Tobago are Mexican American Indian (12.3%, a difference of 0.010%), Immigrants from Panama (12.3%, a difference of 0.040%), Honduran (12.3%, a difference of 0.040%), Swedish (12.3%, a difference of 0.10%), and Ukrainian (12.3%, a difference of 0.12%).
| Demographics | Rating | Rank | Female Disability |
| Immigrants | Honduras | 31.3 /100 | #190 | Fair 12.3% |
| Armenians | 29.7 /100 | #191 | Fair 12.3% |
| Immigrants | Western Africa | 29.2 /100 | #192 | Fair 12.3% |
| Northern Europeans | 27.5 /100 | #193 | Fair 12.3% |
| Ukrainians | 27.2 /100 | #194 | Fair 12.3% |
| Swedes | 26.6 /100 | #195 | Fair 12.3% |
| Immigrants | Panama | 25.5 /100 | #196 | Fair 12.3% |
| Hondurans | 25.4 /100 | #197 | Fair 12.3% |
| Mexican American Indians | 24.9 /100 | #198 | Fair 12.3% |
| Immigrants | Trinidad and Tobago | 24.7 /100 | #199 | Fair 12.3% |
| Trinidadians and Tobagonians | 22.4 /100 | #200 | Fair 12.3% |
| Chinese | 22.1 /100 | #201 | Fair 12.3% |
| Somalis | 21.5 /100 | #202 | Fair 12.3% |
| Immigrants | Barbados | 21.1 /100 | #203 | Fair 12.3% |
| Immigrants | Zaire | 20.9 /100 | #204 | Fair 12.3% |
| Immigrants | Grenada | 20.5 /100 | #205 | Fair 12.4% |
| Immigrants | Cuba | 20.2 /100 | #206 | Fair 12.4% |
| Croatians | 20.2 /100 | #207 | Fair 12.4% |
| Basques | 17.5 /100 | #208 | Poor 12.4% |
| Mexicans | 15.7 /100 | #209 | Poor 12.4% |
| Swiss | 14.9 /100 | #210 | Poor 12.4% |