Chinese vs Black/African American Female Disability
COMPARE
Chinese
Black/African American
Female Disability
Female Disability Comparison
Chinese
Blacks/African Americans
12.3%
FEMALE DISABILITY
22.1/ 100
METRIC RATING
201st/ 347
METRIC RANK
14.1%
FEMALE DISABILITY
0.0/ 100
METRIC RATING
323rd/ 347
METRIC RANK
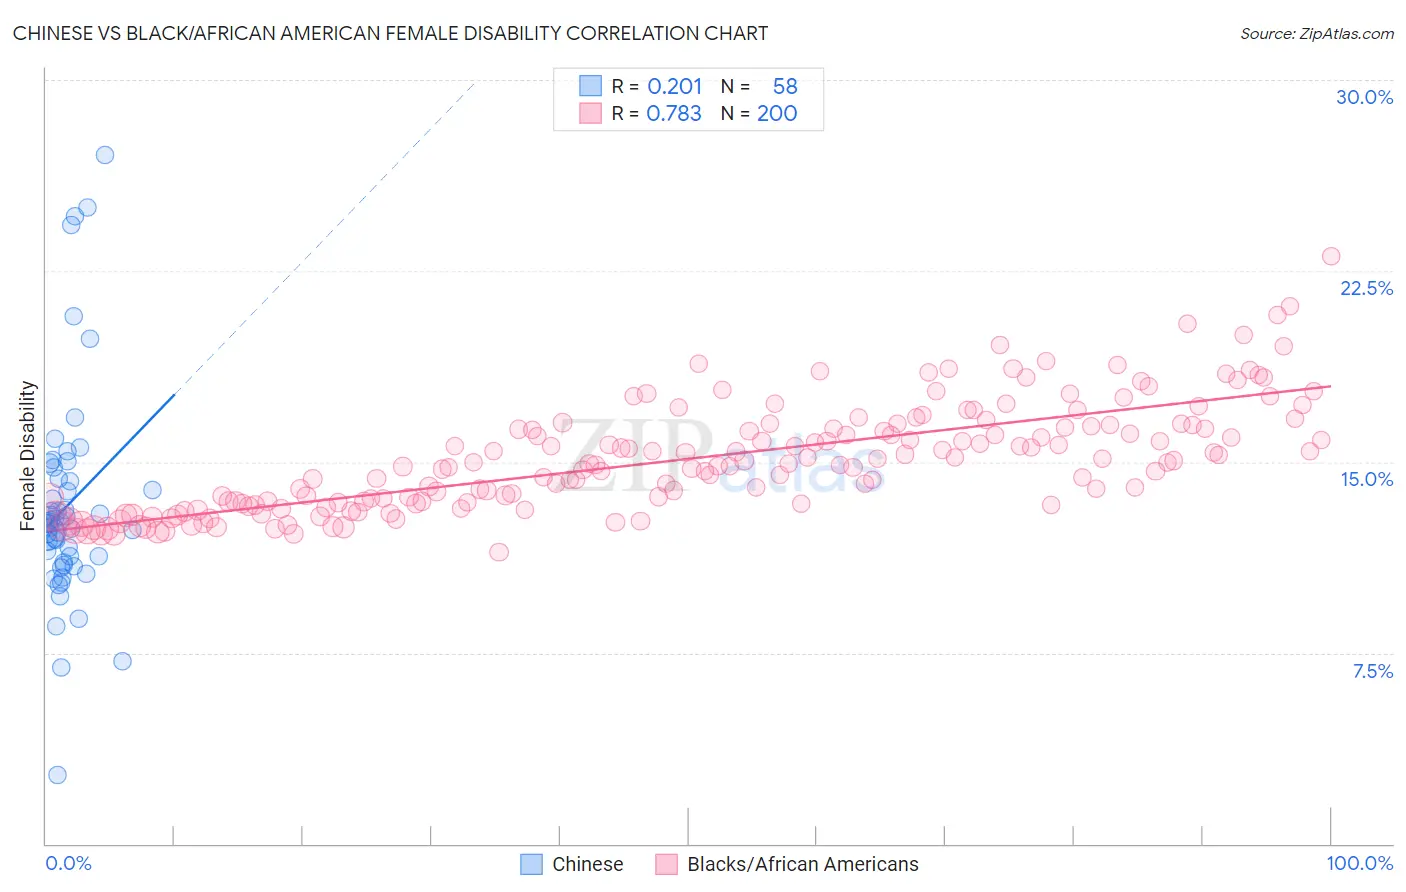
Chinese vs Black/African American Female Disability Correlation Chart
The statistical analysis conducted on geographies consisting of 64,802,500 people shows a weak positive correlation between the proportion of Chinese and percentage of females with a disability in the United States with a correlation coefficient (R) of 0.201 and weighted average of 12.3%. Similarly, the statistical analysis conducted on geographies consisting of 565,768,097 people shows a strong positive correlation between the proportion of Blacks/African Americans and percentage of females with a disability in the United States with a correlation coefficient (R) of 0.783 and weighted average of 14.1%, a difference of 14.6%.
Female Disability Correlation Summary
| Measurement | Chinese | Black/African American |
| Minimum | 2.7% | 11.4% |
| Maximum | 27.1% | 23.1% |
| Range | 24.4% | 11.6% |
| Mean | 13.3% | 15.1% |
| Median | 12.6% | 14.9% |
| Interquartile 25% (IQ1) | 11.1% | 13.4% |
| Interquartile 75% (IQ3) | 14.3% | 16.4% |
| Interquartile Range (IQR) | 3.3% | 3.0% |
| Standard Deviation (Sample) | 4.3% | 2.1% |
| Standard Deviation (Population) | 4.3% | 2.1% |
Similar Demographics by Female Disability
Demographics Similar to Chinese by Female Disability
In terms of female disability, the demographic groups most similar to Chinese are Trinidadian and Tobagonian (12.3%, a difference of 0.010%), Somali (12.3%, a difference of 0.030%), Immigrants from Barbados (12.3%, a difference of 0.050%), Immigrants from Zaire (12.3%, a difference of 0.070%), and Immigrants from Grenada (12.4%, a difference of 0.090%).
| Demographics | Rating | Rank | Female Disability |
| Ukrainians | 27.2 /100 | #194 | Fair 12.3% |
| Swedes | 26.6 /100 | #195 | Fair 12.3% |
| Immigrants | Panama | 25.5 /100 | #196 | Fair 12.3% |
| Hondurans | 25.4 /100 | #197 | Fair 12.3% |
| Mexican American Indians | 24.9 /100 | #198 | Fair 12.3% |
| Immigrants | Trinidad and Tobago | 24.7 /100 | #199 | Fair 12.3% |
| Trinidadians and Tobagonians | 22.4 /100 | #200 | Fair 12.3% |
| Chinese | 22.1 /100 | #201 | Fair 12.3% |
| Somalis | 21.5 /100 | #202 | Fair 12.3% |
| Immigrants | Barbados | 21.1 /100 | #203 | Fair 12.3% |
| Immigrants | Zaire | 20.9 /100 | #204 | Fair 12.3% |
| Immigrants | Grenada | 20.5 /100 | #205 | Fair 12.4% |
| Immigrants | Cuba | 20.2 /100 | #206 | Fair 12.4% |
| Croatians | 20.2 /100 | #207 | Fair 12.4% |
| Basques | 17.5 /100 | #208 | Poor 12.4% |
Demographics Similar to Blacks/African Americans by Female Disability
In terms of female disability, the demographic groups most similar to Blacks/African Americans are Native/Alaskan (14.1%, a difference of 0.020%), Navajo (14.2%, a difference of 0.16%), Pueblo (14.1%, a difference of 0.17%), Potawatomi (14.1%, a difference of 0.18%), and Comanche (14.2%, a difference of 0.27%).
| Demographics | Rating | Rank | Female Disability |
| Spanish Americans | 0.0 /100 | #316 | Tragic 14.0% |
| Chippewa | 0.0 /100 | #317 | Tragic 14.0% |
| Paiute | 0.0 /100 | #318 | Tragic 14.0% |
| Iroquois | 0.0 /100 | #319 | Tragic 14.0% |
| Americans | 0.0 /100 | #320 | Tragic 14.1% |
| Potawatomi | 0.0 /100 | #321 | Tragic 14.1% |
| Pueblo | 0.0 /100 | #322 | Tragic 14.1% |
| Blacks/African Americans | 0.0 /100 | #323 | Tragic 14.1% |
| Natives/Alaskans | 0.0 /100 | #324 | Tragic 14.1% |
| Navajo | 0.0 /100 | #325 | Tragic 14.2% |
| Comanche | 0.0 /100 | #326 | Tragic 14.2% |
| Ottawa | 0.0 /100 | #327 | Tragic 14.2% |
| Cape Verdeans | 0.0 /100 | #328 | Tragic 14.2% |
| Osage | 0.0 /100 | #329 | Tragic 14.3% |
| Yuman | 0.0 /100 | #330 | Tragic 14.5% |