Costa Rican vs Immigrants from Trinidad and Tobago Female Disability
COMPARE
Costa Rican
Immigrants from Trinidad and Tobago
Female Disability
Female Disability Comparison
Costa Ricans
Immigrants from Trinidad and Tobago
11.7%
FEMALE DISABILITY
98.1/ 100
METRIC RATING
111th/ 347
METRIC RANK
12.3%
FEMALE DISABILITY
24.7/ 100
METRIC RATING
199th/ 347
METRIC RANK
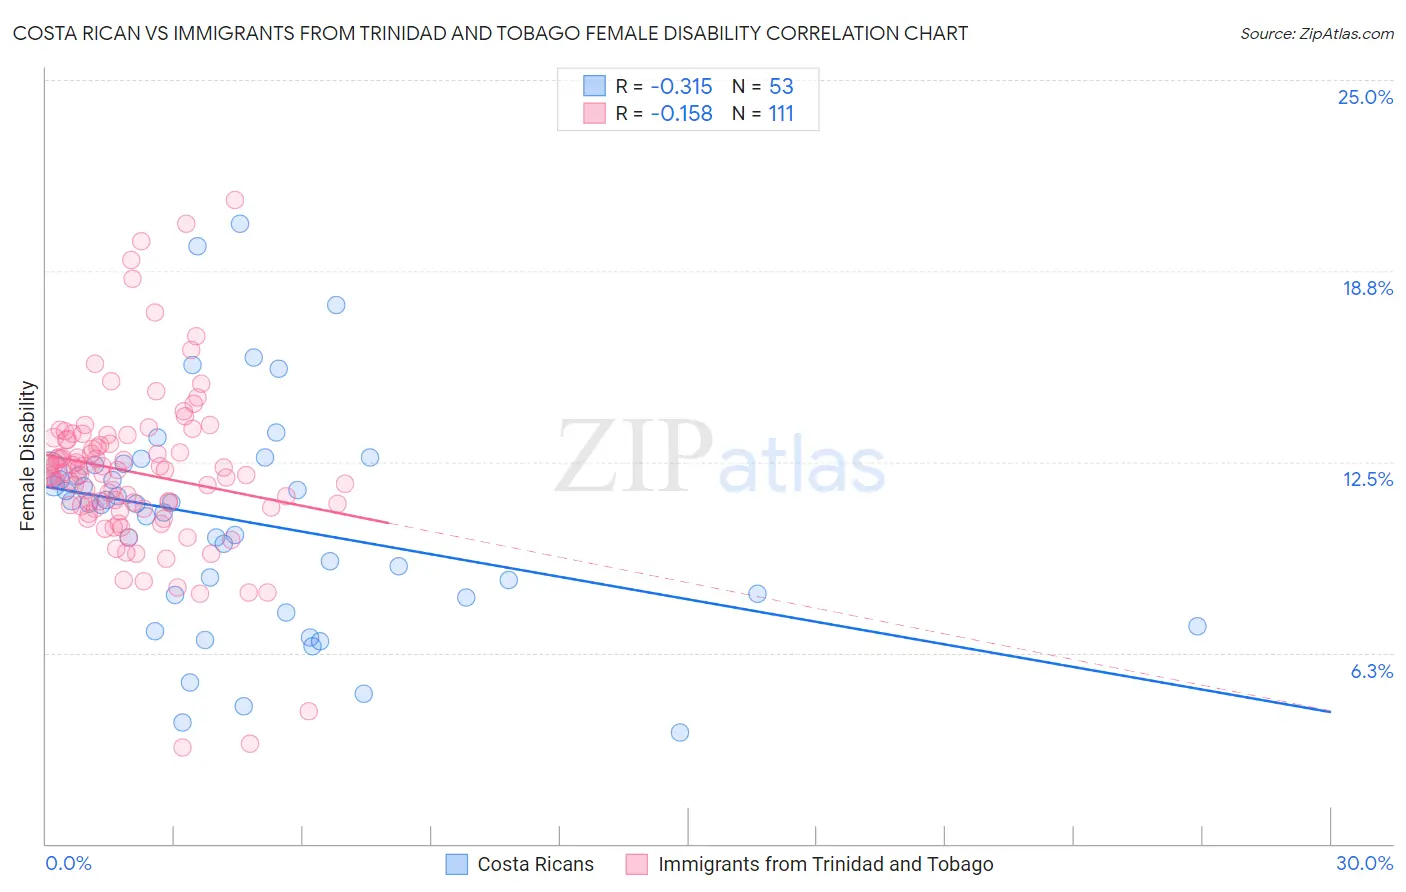
Costa Rican vs Immigrants from Trinidad and Tobago Female Disability Correlation Chart
The statistical analysis conducted on geographies consisting of 253,556,053 people shows a mild negative correlation between the proportion of Costa Ricans and percentage of females with a disability in the United States with a correlation coefficient (R) of -0.315 and weighted average of 11.7%. Similarly, the statistical analysis conducted on geographies consisting of 223,503,313 people shows a poor negative correlation between the proportion of Immigrants from Trinidad and Tobago and percentage of females with a disability in the United States with a correlation coefficient (R) of -0.158 and weighted average of 12.3%, a difference of 4.9%.
Female Disability Correlation Summary
| Measurement | Costa Rican | Immigrants from Trinidad and Tobago |
| Minimum | 3.6% | 3.2% |
| Maximum | 20.3% | 21.1% |
| Range | 16.7% | 17.9% |
| Mean | 10.6% | 12.1% |
| Median | 11.1% | 12.1% |
| Interquartile 25% (IQ1) | 8.1% | 11.0% |
| Interquartile 75% (IQ3) | 12.3% | 13.2% |
| Interquartile Range (IQR) | 4.2% | 2.3% |
| Standard Deviation (Sample) | 3.6% | 2.8% |
| Standard Deviation (Population) | 3.6% | 2.7% |
Similar Demographics by Female Disability
Demographics Similar to Costa Ricans by Female Disability
In terms of female disability, the demographic groups most similar to Costa Ricans are Immigrants (11.7%, a difference of 0.020%), Soviet Union (11.7%, a difference of 0.020%), New Zealander (11.7%, a difference of 0.050%), Latvian (11.7%, a difference of 0.070%), and Immigrants from Greece (11.7%, a difference of 0.090%).
| Demographics | Rating | Rank | Female Disability |
| Immigrants | Western Asia | 98.3 /100 | #104 | Exceptional 11.7% |
| Australians | 98.3 /100 | #105 | Exceptional 11.7% |
| Immigrants | Greece | 98.2 /100 | #106 | Exceptional 11.7% |
| Latvians | 98.2 /100 | #107 | Exceptional 11.7% |
| New Zealanders | 98.1 /100 | #108 | Exceptional 11.7% |
| Immigrants | Immigrants | 98.1 /100 | #109 | Exceptional 11.7% |
| Soviet Union | 98.1 /100 | #110 | Exceptional 11.7% |
| Costa Ricans | 98.1 /100 | #111 | Exceptional 11.7% |
| Immigrants | Bangladesh | 97.8 /100 | #112 | Exceptional 11.8% |
| Immigrants | Belarus | 97.8 /100 | #113 | Exceptional 11.8% |
| South Africans | 97.7 /100 | #114 | Exceptional 11.8% |
| Brazilians | 97.7 /100 | #115 | Exceptional 11.8% |
| Immigrants | Morocco | 97.6 /100 | #116 | Exceptional 11.8% |
| Immigrants | Eastern Europe | 97.2 /100 | #117 | Exceptional 11.8% |
| Immigrants | Nigeria | 97.2 /100 | #118 | Exceptional 11.8% |
Demographics Similar to Immigrants from Trinidad and Tobago by Female Disability
In terms of female disability, the demographic groups most similar to Immigrants from Trinidad and Tobago are Mexican American Indian (12.3%, a difference of 0.010%), Immigrants from Panama (12.3%, a difference of 0.040%), Honduran (12.3%, a difference of 0.040%), Swedish (12.3%, a difference of 0.10%), and Ukrainian (12.3%, a difference of 0.12%).
| Demographics | Rating | Rank | Female Disability |
| Immigrants | Western Africa | 29.2 /100 | #192 | Fair 12.3% |
| Northern Europeans | 27.5 /100 | #193 | Fair 12.3% |
| Ukrainians | 27.2 /100 | #194 | Fair 12.3% |
| Swedes | 26.6 /100 | #195 | Fair 12.3% |
| Immigrants | Panama | 25.5 /100 | #196 | Fair 12.3% |
| Hondurans | 25.4 /100 | #197 | Fair 12.3% |
| Mexican American Indians | 24.9 /100 | #198 | Fair 12.3% |
| Immigrants | Trinidad and Tobago | 24.7 /100 | #199 | Fair 12.3% |
| Trinidadians and Tobagonians | 22.4 /100 | #200 | Fair 12.3% |
| Chinese | 22.1 /100 | #201 | Fair 12.3% |
| Somalis | 21.5 /100 | #202 | Fair 12.3% |
| Immigrants | Barbados | 21.1 /100 | #203 | Fair 12.3% |
| Immigrants | Zaire | 20.9 /100 | #204 | Fair 12.3% |
| Immigrants | Grenada | 20.5 /100 | #205 | Fair 12.4% |
| Immigrants | Cuba | 20.2 /100 | #206 | Fair 12.4% |