Chinese vs Central American Female Disability
COMPARE
Chinese
Central American
Female Disability
Female Disability Comparison
Chinese
Central Americans
12.3%
FEMALE DISABILITY
22.1/ 100
METRIC RATING
201st/ 347
METRIC RANK
11.9%
FEMALE DISABILITY
94.2/ 100
METRIC RATING
135th/ 347
METRIC RANK
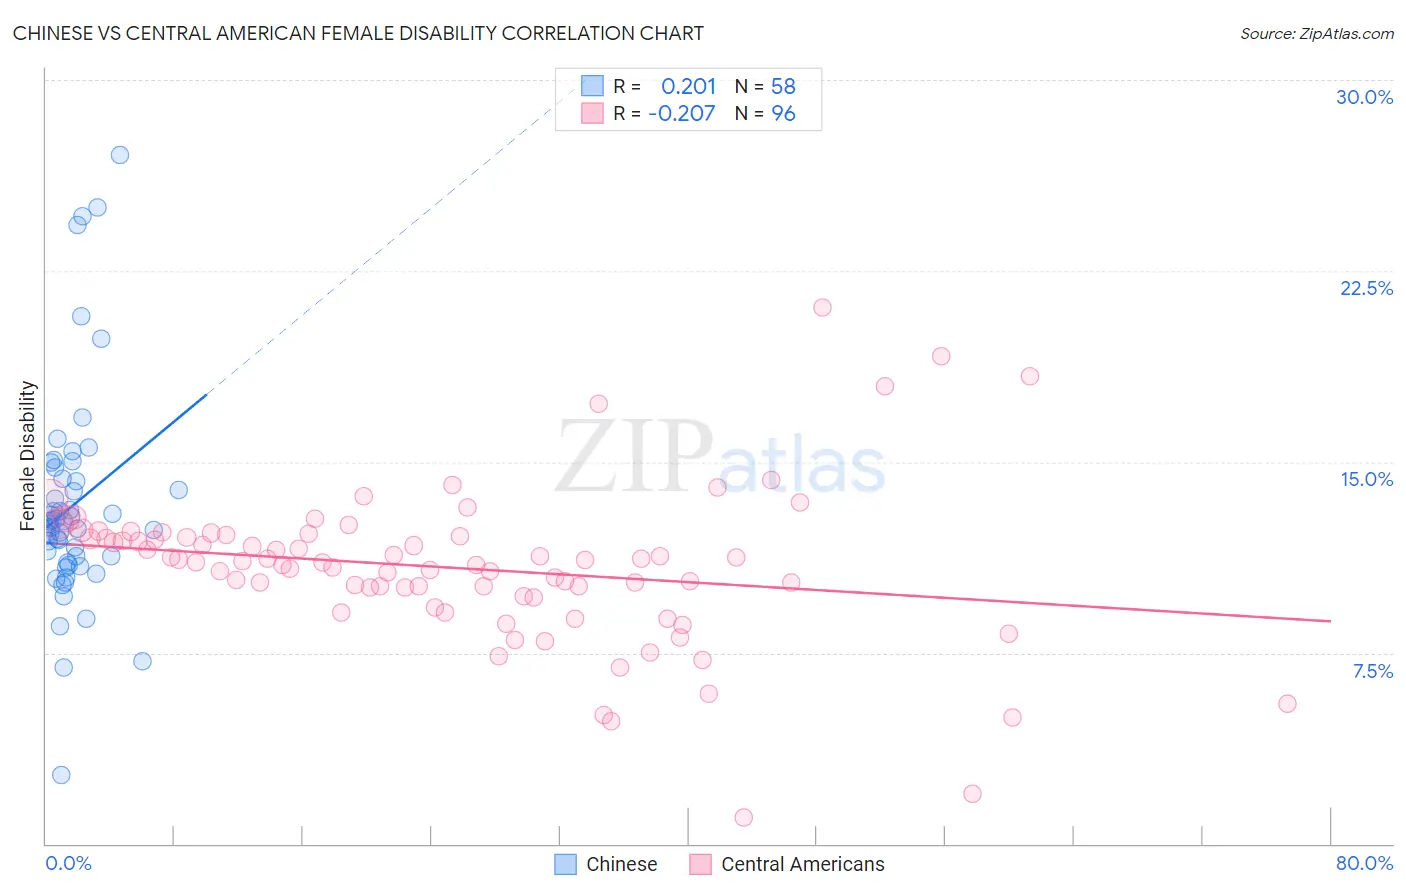
Chinese vs Central American Female Disability Correlation Chart
The statistical analysis conducted on geographies consisting of 64,802,500 people shows a weak positive correlation between the proportion of Chinese and percentage of females with a disability in the United States with a correlation coefficient (R) of 0.201 and weighted average of 12.3%. Similarly, the statistical analysis conducted on geographies consisting of 504,442,047 people shows a weak negative correlation between the proportion of Central Americans and percentage of females with a disability in the United States with a correlation coefficient (R) of -0.207 and weighted average of 11.9%, a difference of 3.9%.
Female Disability Correlation Summary
| Measurement | Chinese | Central American |
| Minimum | 2.7% | 1.0% |
| Maximum | 27.1% | 21.1% |
| Range | 24.4% | 20.0% |
| Mean | 13.3% | 10.8% |
| Median | 12.6% | 11.1% |
| Interquartile 25% (IQ1) | 11.1% | 9.9% |
| Interquartile 75% (IQ3) | 14.3% | 12.1% |
| Interquartile Range (IQR) | 3.3% | 2.2% |
| Standard Deviation (Sample) | 4.3% | 3.0% |
| Standard Deviation (Population) | 4.3% | 3.0% |
Similar Demographics by Female Disability
Demographics Similar to Chinese by Female Disability
In terms of female disability, the demographic groups most similar to Chinese are Trinidadian and Tobagonian (12.3%, a difference of 0.010%), Somali (12.3%, a difference of 0.030%), Immigrants from Barbados (12.3%, a difference of 0.050%), Immigrants from Zaire (12.3%, a difference of 0.070%), and Immigrants from Grenada (12.4%, a difference of 0.090%).
| Demographics | Rating | Rank | Female Disability |
| Ukrainians | 27.2 /100 | #194 | Fair 12.3% |
| Swedes | 26.6 /100 | #195 | Fair 12.3% |
| Immigrants | Panama | 25.5 /100 | #196 | Fair 12.3% |
| Hondurans | 25.4 /100 | #197 | Fair 12.3% |
| Mexican American Indians | 24.9 /100 | #198 | Fair 12.3% |
| Immigrants | Trinidad and Tobago | 24.7 /100 | #199 | Fair 12.3% |
| Trinidadians and Tobagonians | 22.4 /100 | #200 | Fair 12.3% |
| Chinese | 22.1 /100 | #201 | Fair 12.3% |
| Somalis | 21.5 /100 | #202 | Fair 12.3% |
| Immigrants | Barbados | 21.1 /100 | #203 | Fair 12.3% |
| Immigrants | Zaire | 20.9 /100 | #204 | Fair 12.3% |
| Immigrants | Grenada | 20.5 /100 | #205 | Fair 12.4% |
| Immigrants | Cuba | 20.2 /100 | #206 | Fair 12.4% |
| Croatians | 20.2 /100 | #207 | Fair 12.4% |
| Basques | 17.5 /100 | #208 | Poor 12.4% |
Demographics Similar to Central Americans by Female Disability
In terms of female disability, the demographic groups most similar to Central Americans are Ugandan (11.9%, a difference of 0.030%), Immigrants from Norway (11.9%, a difference of 0.060%), Kenyan (11.9%, a difference of 0.070%), Immigrants from Nicaragua (11.9%, a difference of 0.070%), and Immigrants from Syria (11.9%, a difference of 0.080%).
| Demographics | Rating | Rank | Female Disability |
| Immigrants | Latvia | 95.6 /100 | #128 | Exceptional 11.8% |
| Macedonians | 95.5 /100 | #129 | Exceptional 11.8% |
| Nicaraguans | 95.2 /100 | #130 | Exceptional 11.9% |
| Arabs | 95.1 /100 | #131 | Exceptional 11.9% |
| Immigrants | Syria | 94.6 /100 | #132 | Exceptional 11.9% |
| Kenyans | 94.5 /100 | #133 | Exceptional 11.9% |
| Immigrants | Nicaragua | 94.5 /100 | #134 | Exceptional 11.9% |
| Central Americans | 94.2 /100 | #135 | Exceptional 11.9% |
| Ugandans | 94.0 /100 | #136 | Exceptional 11.9% |
| Immigrants | Norway | 93.8 /100 | #137 | Exceptional 11.9% |
| Ecuadorians | 93.4 /100 | #138 | Exceptional 11.9% |
| Immigrants | Hungary | 92.8 /100 | #139 | Exceptional 11.9% |
| Romanians | 91.6 /100 | #140 | Exceptional 11.9% |
| Immigrants | Ecuador | 91.5 /100 | #141 | Exceptional 11.9% |
| Immigrants | Africa | 90.0 /100 | #142 | Excellent 11.9% |