Choctaw vs Immigrants from Jamaica Hearing Disability
COMPARE
Choctaw
Immigrants from Jamaica
Hearing Disability
Hearing Disability Comparison
Choctaw
Immigrants from Jamaica
4.5%
HEARING DISABILITY
0.0/ 100
METRIC RATING
339th/ 347
METRIC RANK
2.6%
HEARING DISABILITY
99.5/ 100
METRIC RATING
38th/ 347
METRIC RANK
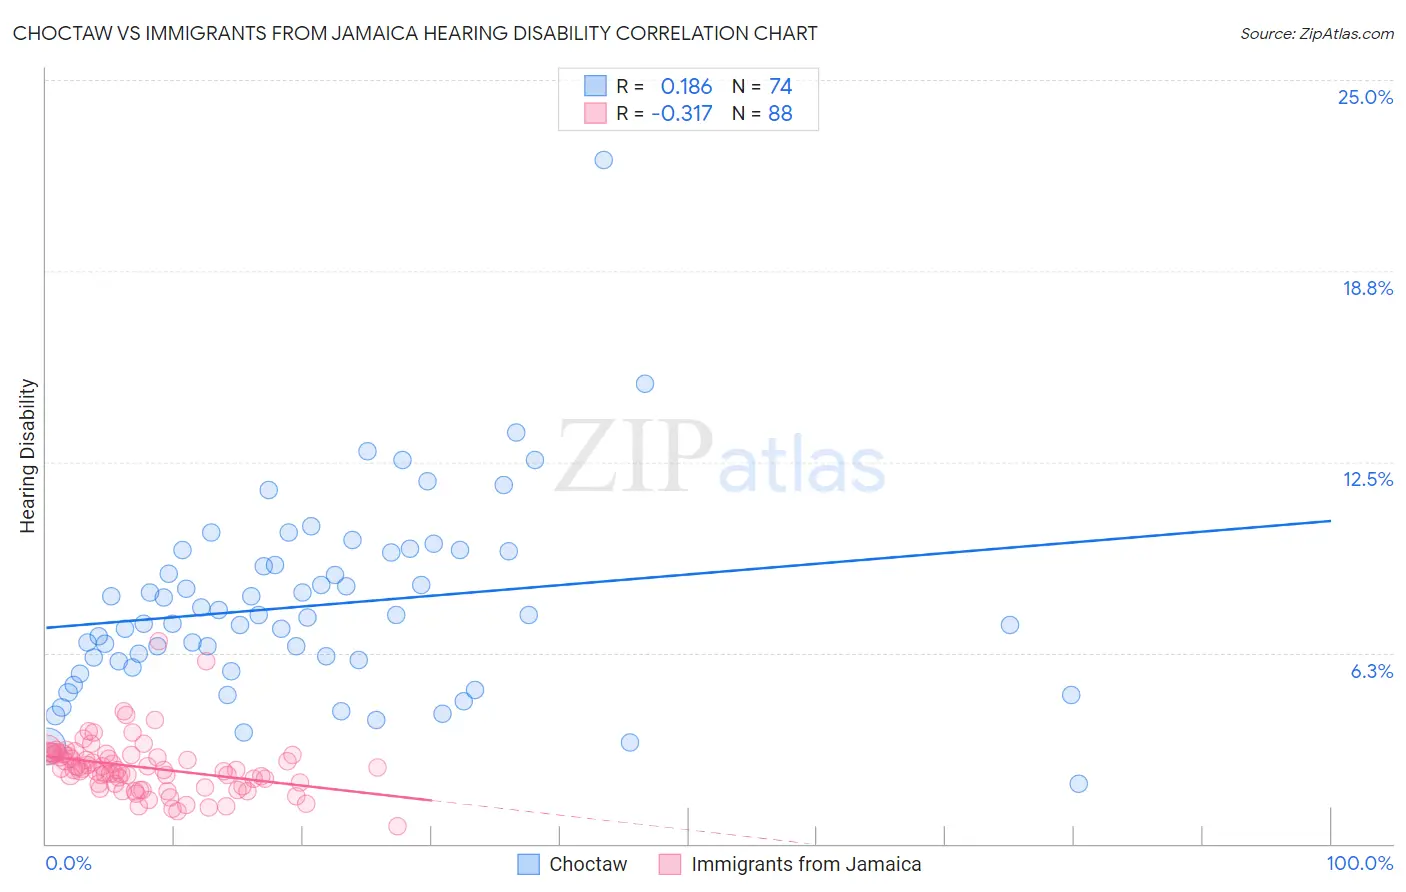
Choctaw vs Immigrants from Jamaica Hearing Disability Correlation Chart
The statistical analysis conducted on geographies consisting of 269,646,224 people shows a poor positive correlation between the proportion of Choctaw and percentage of population with hearing disability in the United States with a correlation coefficient (R) of 0.186 and weighted average of 4.5%. Similarly, the statistical analysis conducted on geographies consisting of 301,631,543 people shows a mild negative correlation between the proportion of Immigrants from Jamaica and percentage of population with hearing disability in the United States with a correlation coefficient (R) of -0.317 and weighted average of 2.6%, a difference of 73.8%.
Hearing Disability Correlation Summary
| Measurement | Choctaw | Immigrants from Jamaica |
| Minimum | 1.9% | 0.58% |
| Maximum | 22.4% | 6.6% |
| Range | 20.4% | 6.0% |
| Mean | 7.8% | 2.5% |
| Median | 7.4% | 2.4% |
| Interquartile 25% (IQ1) | 6.0% | 1.9% |
| Interquartile 75% (IQ3) | 9.5% | 2.9% |
| Interquartile Range (IQR) | 3.6% | 1.0% |
| Standard Deviation (Sample) | 3.1% | 0.92% |
| Standard Deviation (Population) | 3.1% | 0.92% |
Similar Demographics by Hearing Disability
Demographics Similar to Choctaw by Hearing Disability
In terms of hearing disability, the demographic groups most similar to Choctaw are Alaska Native (4.5%, a difference of 1.4%), Pueblo (4.6%, a difference of 1.5%), Chickasaw (4.5%, a difference of 1.6%), Navajo (4.6%, a difference of 1.8%), and Tsimshian (4.7%, a difference of 3.4%).
| Demographics | Rating | Rank | Hearing Disability |
| Houma | 0.0 /100 | #332 | Tragic 4.2% |
| Dutch West Indians | 0.0 /100 | #333 | Tragic 4.3% |
| Aleuts | 0.0 /100 | #334 | Tragic 4.3% |
| Kiowa | 0.0 /100 | #335 | Tragic 4.3% |
| Creek | 0.0 /100 | #336 | Tragic 4.4% |
| Chickasaw | 0.0 /100 | #337 | Tragic 4.5% |
| Alaska Natives | 0.0 /100 | #338 | Tragic 4.5% |
| Choctaw | 0.0 /100 | #339 | Tragic 4.5% |
| Pueblo | 0.0 /100 | #340 | Tragic 4.6% |
| Navajo | 0.0 /100 | #341 | Tragic 4.6% |
| Tsimshian | 0.0 /100 | #342 | Tragic 4.7% |
| Inupiat | 0.0 /100 | #343 | Tragic 4.7% |
| Tlingit-Haida | 0.0 /100 | #344 | Tragic 4.8% |
| Alaskan Athabascans | 0.0 /100 | #345 | Tragic 5.3% |
| Colville | 0.0 /100 | #346 | Tragic 5.3% |
Demographics Similar to Immigrants from Jamaica by Hearing Disability
In terms of hearing disability, the demographic groups most similar to Immigrants from Jamaica are Immigrants from Western Africa (2.6%, a difference of 0.080%), Okinawan (2.6%, a difference of 0.11%), Immigrants from China (2.6%, a difference of 0.24%), Haitian (2.6%, a difference of 0.32%), and Salvadoran (2.6%, a difference of 0.33%).
| Demographics | Rating | Rank | Hearing Disability |
| Immigrants | Cameroon | 99.7 /100 | #31 | Exceptional 2.6% |
| Immigrants | Venezuela | 99.7 /100 | #32 | Exceptional 2.6% |
| Filipinos | 99.6 /100 | #33 | Exceptional 2.6% |
| Immigrants | Pakistan | 99.6 /100 | #34 | Exceptional 2.6% |
| Salvadorans | 99.6 /100 | #35 | Exceptional 2.6% |
| Okinawans | 99.6 /100 | #36 | Exceptional 2.6% |
| Immigrants | Western Africa | 99.6 /100 | #37 | Exceptional 2.6% |
| Immigrants | Jamaica | 99.5 /100 | #38 | Exceptional 2.6% |
| Immigrants | China | 99.5 /100 | #39 | Exceptional 2.6% |
| Haitians | 99.5 /100 | #40 | Exceptional 2.6% |
| Immigrants | Taiwan | 99.4 /100 | #41 | Exceptional 2.6% |
| West Indians | 99.4 /100 | #42 | Exceptional 2.6% |
| Senegalese | 99.4 /100 | #43 | Exceptional 2.6% |
| Nigerians | 99.4 /100 | #44 | Exceptional 2.6% |
| Venezuelans | 99.4 /100 | #45 | Exceptional 2.6% |