Cherokee vs Immigrants from Jamaica Hearing Disability
COMPARE
Cherokee
Immigrants from Jamaica
Hearing Disability
Hearing Disability Comparison
Cherokee
Immigrants from Jamaica
4.2%
HEARING DISABILITY
0.0/ 100
METRIC RATING
331st/ 347
METRIC RANK
2.6%
HEARING DISABILITY
99.5/ 100
METRIC RATING
38th/ 347
METRIC RANK
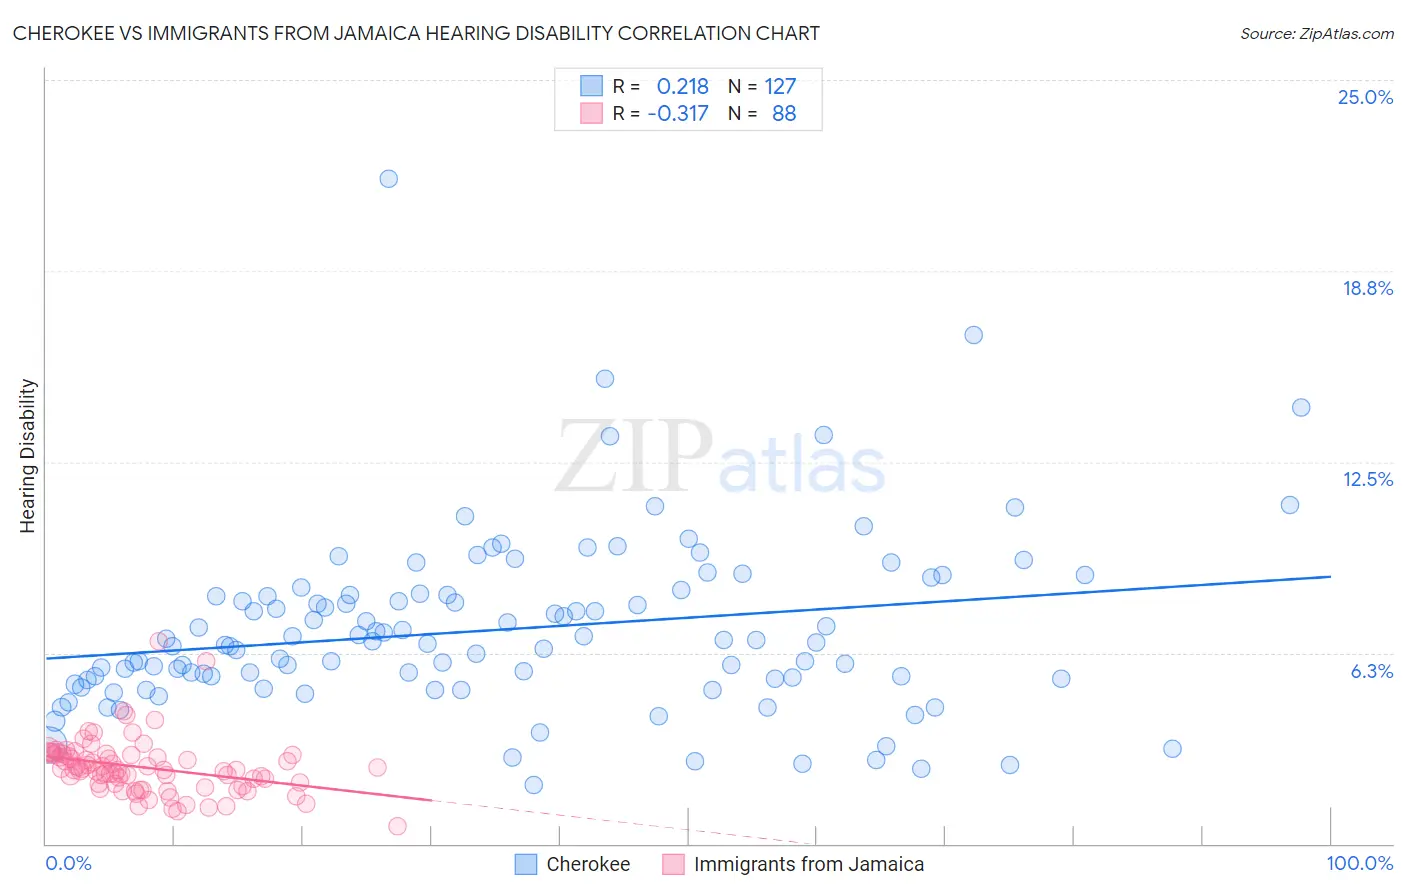
Cherokee vs Immigrants from Jamaica Hearing Disability Correlation Chart
The statistical analysis conducted on geographies consisting of 493,388,222 people shows a weak positive correlation between the proportion of Cherokee and percentage of population with hearing disability in the United States with a correlation coefficient (R) of 0.218 and weighted average of 4.2%. Similarly, the statistical analysis conducted on geographies consisting of 301,631,543 people shows a mild negative correlation between the proportion of Immigrants from Jamaica and percentage of population with hearing disability in the United States with a correlation coefficient (R) of -0.317 and weighted average of 2.6%, a difference of 60.6%.
Hearing Disability Correlation Summary
| Measurement | Cherokee | Immigrants from Jamaica |
| Minimum | 1.9% | 0.58% |
| Maximum | 21.8% | 6.6% |
| Range | 19.8% | 6.0% |
| Mean | 7.0% | 2.5% |
| Median | 6.6% | 2.4% |
| Interquartile 25% (IQ1) | 5.4% | 1.9% |
| Interquartile 75% (IQ3) | 8.1% | 2.9% |
| Interquartile Range (IQR) | 2.8% | 1.0% |
| Standard Deviation (Sample) | 2.9% | 0.92% |
| Standard Deviation (Population) | 2.9% | 0.92% |
Similar Demographics by Hearing Disability
Demographics Similar to Cherokee by Hearing Disability
In terms of hearing disability, the demographic groups most similar to Cherokee are Native/Alaskan (4.2%, a difference of 0.15%), Houma (4.2%, a difference of 0.68%), Crow (4.2%, a difference of 0.94%), Tohono O'odham (4.2%, a difference of 0.95%), and Dutch West Indian (4.3%, a difference of 1.3%).
| Demographics | Rating | Rank | Hearing Disability |
| Osage | 0.0 /100 | #324 | Tragic 4.1% |
| Lumbee | 0.0 /100 | #325 | Tragic 4.1% |
| Potawatomi | 0.0 /100 | #326 | Tragic 4.1% |
| Arapaho | 0.0 /100 | #327 | Tragic 4.1% |
| Tohono O'odham | 0.0 /100 | #328 | Tragic 4.2% |
| Crow | 0.0 /100 | #329 | Tragic 4.2% |
| Natives/Alaskans | 0.0 /100 | #330 | Tragic 4.2% |
| Cherokee | 0.0 /100 | #331 | Tragic 4.2% |
| Houma | 0.0 /100 | #332 | Tragic 4.2% |
| Dutch West Indians | 0.0 /100 | #333 | Tragic 4.3% |
| Aleuts | 0.0 /100 | #334 | Tragic 4.3% |
| Kiowa | 0.0 /100 | #335 | Tragic 4.3% |
| Creek | 0.0 /100 | #336 | Tragic 4.4% |
| Chickasaw | 0.0 /100 | #337 | Tragic 4.5% |
| Alaska Natives | 0.0 /100 | #338 | Tragic 4.5% |
Demographics Similar to Immigrants from Jamaica by Hearing Disability
In terms of hearing disability, the demographic groups most similar to Immigrants from Jamaica are Immigrants from Western Africa (2.6%, a difference of 0.080%), Okinawan (2.6%, a difference of 0.11%), Immigrants from China (2.6%, a difference of 0.24%), Haitian (2.6%, a difference of 0.32%), and Salvadoran (2.6%, a difference of 0.33%).
| Demographics | Rating | Rank | Hearing Disability |
| Immigrants | Cameroon | 99.7 /100 | #31 | Exceptional 2.6% |
| Immigrants | Venezuela | 99.7 /100 | #32 | Exceptional 2.6% |
| Filipinos | 99.6 /100 | #33 | Exceptional 2.6% |
| Immigrants | Pakistan | 99.6 /100 | #34 | Exceptional 2.6% |
| Salvadorans | 99.6 /100 | #35 | Exceptional 2.6% |
| Okinawans | 99.6 /100 | #36 | Exceptional 2.6% |
| Immigrants | Western Africa | 99.6 /100 | #37 | Exceptional 2.6% |
| Immigrants | Jamaica | 99.5 /100 | #38 | Exceptional 2.6% |
| Immigrants | China | 99.5 /100 | #39 | Exceptional 2.6% |
| Haitians | 99.5 /100 | #40 | Exceptional 2.6% |
| Immigrants | Taiwan | 99.4 /100 | #41 | Exceptional 2.6% |
| West Indians | 99.4 /100 | #42 | Exceptional 2.6% |
| Senegalese | 99.4 /100 | #43 | Exceptional 2.6% |
| Nigerians | 99.4 /100 | #44 | Exceptional 2.6% |
| Venezuelans | 99.4 /100 | #45 | Exceptional 2.6% |