Chickasaw vs U.S. Virgin Islander Family Households
COMPARE
Chickasaw
U.S. Virgin Islander
Family Households
Family Households Comparison
Chickasaw
U.S. Virgin Islanders
64.4%
FAMILY HOUSEHOLDS
61.5/ 100
METRIC RATING
163rd/ 347
METRIC RANK
62.6%
FAMILY HOUSEHOLDS
0.0/ 100
METRIC RATING
291st/ 347
METRIC RANK
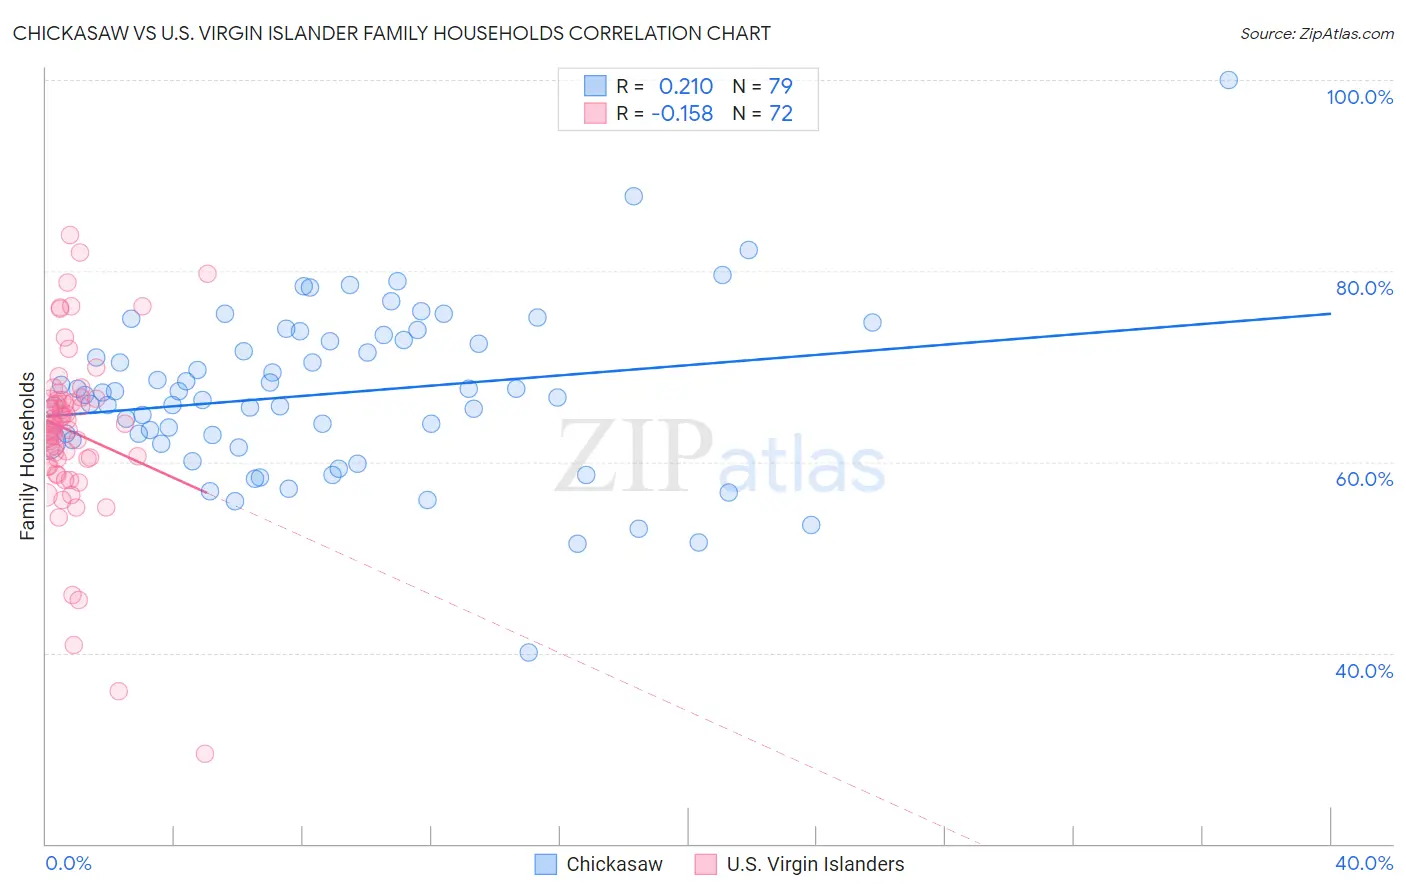
Chickasaw vs U.S. Virgin Islander Family Households Correlation Chart
The statistical analysis conducted on geographies consisting of 147,674,365 people shows a weak positive correlation between the proportion of Chickasaw and percentage of family households in the United States with a correlation coefficient (R) of 0.210 and weighted average of 64.4%. Similarly, the statistical analysis conducted on geographies consisting of 87,507,759 people shows a poor negative correlation between the proportion of U.S. Virgin Islanders and percentage of family households in the United States with a correlation coefficient (R) of -0.158 and weighted average of 62.6%, a difference of 2.9%.
Family Households Correlation Summary
| Measurement | Chickasaw | U.S. Virgin Islander |
| Minimum | 40.0% | 29.5% |
| Maximum | 100.0% | 83.8% |
| Range | 60.0% | 54.3% |
| Mean | 67.1% | 63.2% |
| Median | 67.0% | 63.9% |
| Interquartile 25% (IQ1) | 62.2% | 59.9% |
| Interquartile 75% (IQ3) | 72.8% | 66.5% |
| Interquartile Range (IQR) | 10.6% | 6.6% |
| Standard Deviation (Sample) | 8.9% | 9.1% |
| Standard Deviation (Population) | 8.8% | 9.1% |
Similar Demographics by Family Households
Demographics Similar to Chickasaw by Family Households
In terms of family households, the demographic groups most similar to Chickasaw are British (64.4%, a difference of 0.0%), Immigrants from England (64.4%, a difference of 0.020%), Immigrants from Nigeria (64.4%, a difference of 0.020%), Immigrants from Southern Europe (64.4%, a difference of 0.020%), and Scotch-Irish (64.4%, a difference of 0.030%).
| Demographics | Rating | Rank | Family Households |
| Czechs | 67.0 /100 | #156 | Good 64.5% |
| Canadians | 66.6 /100 | #157 | Good 64.4% |
| Lebanese | 66.4 /100 | #158 | Good 64.4% |
| Germans | 65.8 /100 | #159 | Good 64.4% |
| Immigrants | Moldova | 65.2 /100 | #160 | Good 64.4% |
| Immigrants | England | 62.6 /100 | #161 | Good 64.4% |
| British | 61.6 /100 | #162 | Good 64.4% |
| Chickasaw | 61.5 /100 | #163 | Good 64.4% |
| Immigrants | Nigeria | 60.1 /100 | #164 | Good 64.4% |
| Immigrants | Southern Europe | 60.0 /100 | #165 | Good 64.4% |
| Scotch-Irish | 59.2 /100 | #166 | Average 64.4% |
| Irish | 57.9 /100 | #167 | Average 64.4% |
| Hondurans | 57.5 /100 | #168 | Average 64.4% |
| Iraqis | 56.0 /100 | #169 | Average 64.4% |
| Armenians | 55.9 /100 | #170 | Average 64.4% |
Demographics Similar to U.S. Virgin Islanders by Family Households
In terms of family households, the demographic groups most similar to U.S. Virgin Islanders are Immigrants from Grenada (62.6%, a difference of 0.050%), Immigrants from Burma/Myanmar (62.6%, a difference of 0.050%), Immigrants from Nepal (62.7%, a difference of 0.13%), Immigrants from Sweden (62.5%, a difference of 0.18%), and Immigrants from Uganda (62.7%, a difference of 0.22%).
| Demographics | Rating | Rank | Family Households |
| Australians | 0.1 /100 | #284 | Tragic 62.8% |
| Mongolians | 0.1 /100 | #285 | Tragic 62.8% |
| British West Indians | 0.1 /100 | #286 | Tragic 62.8% |
| Latvians | 0.1 /100 | #287 | Tragic 62.8% |
| Immigrants | Uganda | 0.1 /100 | #288 | Tragic 62.7% |
| Immigrants | Nepal | 0.1 /100 | #289 | Tragic 62.7% |
| Immigrants | Grenada | 0.0 /100 | #290 | Tragic 62.6% |
| U.S. Virgin Islanders | 0.0 /100 | #291 | Tragic 62.6% |
| Immigrants | Burma/Myanmar | 0.0 /100 | #292 | Tragic 62.6% |
| Immigrants | Sweden | 0.0 /100 | #293 | Tragic 62.5% |
| Barbadians | 0.0 /100 | #294 | Tragic 62.5% |
| Okinawans | 0.0 /100 | #295 | Tragic 62.5% |
| Slovenes | 0.0 /100 | #296 | Tragic 62.4% |
| French American Indians | 0.0 /100 | #297 | Tragic 62.4% |
| Immigrants | Spain | 0.0 /100 | #298 | Tragic 62.4% |