Chickasaw vs Bhutanese Disability Age 5 to 17
COMPARE
Chickasaw
Bhutanese
Disability Age 5 to 17
Disability Age 5 to 17 Comparison
Chickasaw
Bhutanese
6.8%
DISABILITY AGE 5 TO 17
0.0/ 100
METRIC RATING
336th/ 347
METRIC RANK
4.9%
DISABILITY AGE 5 TO 17
100.0/ 100
METRIC RATING
26th/ 347
METRIC RANK
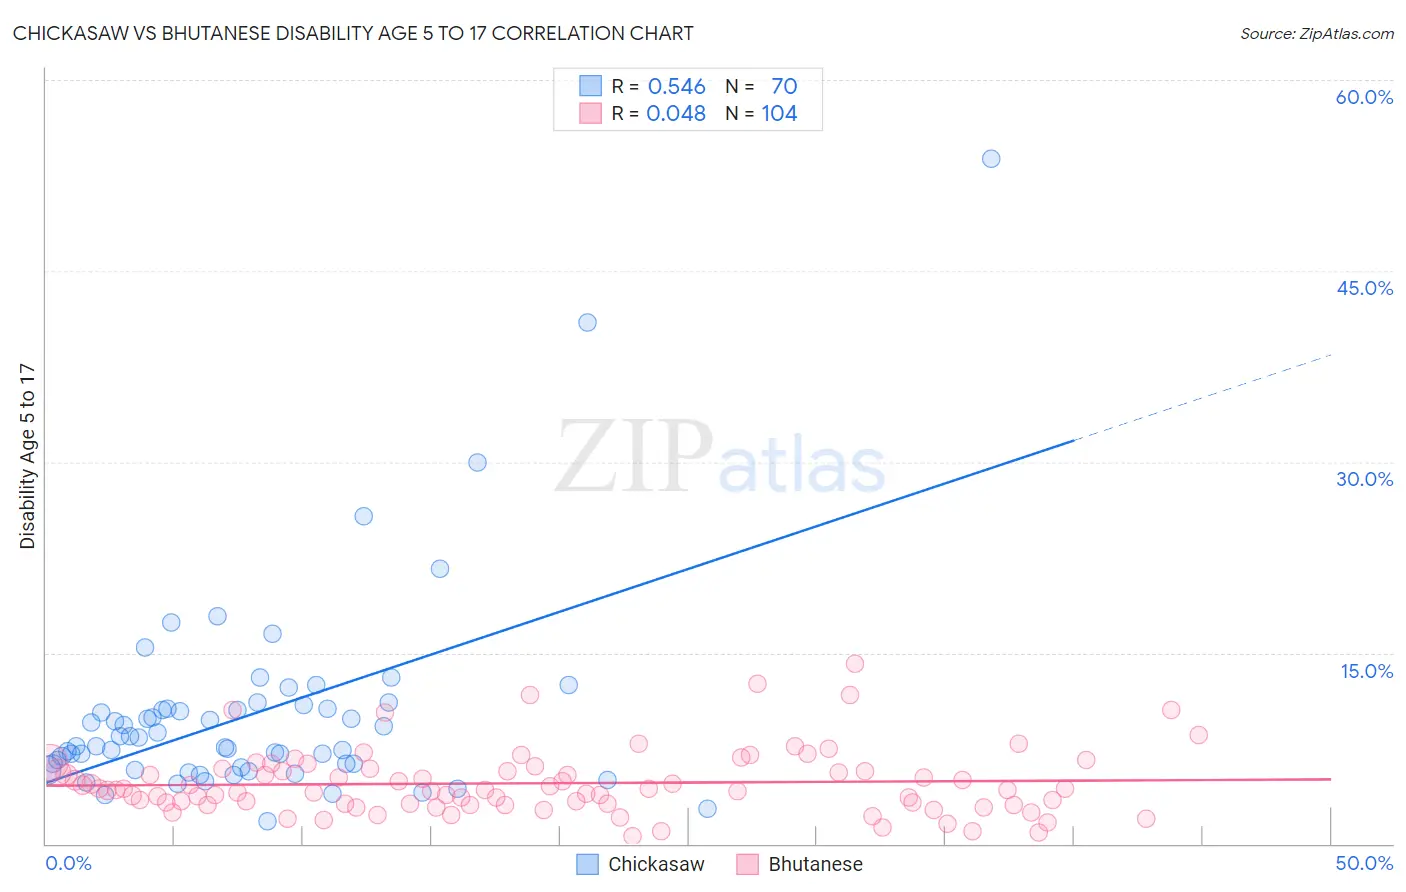
Chickasaw vs Bhutanese Disability Age 5 to 17 Correlation Chart
The statistical analysis conducted on geographies consisting of 147,149,878 people shows a substantial positive correlation between the proportion of Chickasaw and percentage of population with a disability between the ages 5 and 17 in the United States with a correlation coefficient (R) of 0.546 and weighted average of 6.8%. Similarly, the statistical analysis conducted on geographies consisting of 450,824,521 people shows no correlation between the proportion of Bhutanese and percentage of population with a disability between the ages 5 and 17 in the United States with a correlation coefficient (R) of 0.048 and weighted average of 4.9%, a difference of 39.8%.
Disability Age 5 to 17 Correlation Summary
| Measurement | Chickasaw | Bhutanese |
| Minimum | 1.8% | 0.55% |
| Maximum | 53.8% | 14.1% |
| Range | 52.1% | 13.6% |
| Mean | 10.2% | 4.8% |
| Median | 8.0% | 4.3% |
| Interquartile 25% (IQ1) | 6.0% | 3.1% |
| Interquartile 75% (IQ3) | 10.6% | 5.8% |
| Interquartile Range (IQR) | 4.7% | 2.7% |
| Standard Deviation (Sample) | 8.1% | 2.5% |
| Standard Deviation (Population) | 8.1% | 2.5% |
Similar Demographics by Disability Age 5 to 17
Demographics Similar to Chickasaw by Disability Age 5 to 17
In terms of disability age 5 to 17, the demographic groups most similar to Chickasaw are Creek (6.9%, a difference of 0.43%), Ottawa (6.8%, a difference of 0.50%), Iroquois (6.9%, a difference of 0.68%), Choctaw (6.9%, a difference of 1.0%), and Seminole (6.8%, a difference of 1.2%).
| Demographics | Rating | Rank | Disability Age 5 to 17 |
| Blackfeet | 0.0 /100 | #329 | Tragic 6.6% |
| Dutch West Indians | 0.0 /100 | #330 | Tragic 6.7% |
| French Canadians | 0.0 /100 | #331 | Tragic 6.7% |
| Immigrants | Azores | 0.0 /100 | #332 | Tragic 6.7% |
| Blacks/African Americans | 0.0 /100 | #333 | Tragic 6.8% |
| Seminole | 0.0 /100 | #334 | Tragic 6.8% |
| Ottawa | 0.0 /100 | #335 | Tragic 6.8% |
| Chickasaw | 0.0 /100 | #336 | Tragic 6.8% |
| Creek | 0.0 /100 | #337 | Tragic 6.9% |
| Iroquois | 0.0 /100 | #338 | Tragic 6.9% |
| Choctaw | 0.0 /100 | #339 | Tragic 6.9% |
| Cherokee | 0.0 /100 | #340 | Tragic 6.9% |
| Cape Verdeans | 0.0 /100 | #341 | Tragic 7.0% |
| Chippewa | 0.0 /100 | #342 | Tragic 7.1% |
| Immigrants | Cabo Verde | 0.0 /100 | #343 | Tragic 7.1% |
Demographics Similar to Bhutanese by Disability Age 5 to 17
In terms of disability age 5 to 17, the demographic groups most similar to Bhutanese are Taiwanese (4.9%, a difference of 0.56%), Immigrants from Japan (4.9%, a difference of 0.64%), Immigrants from Asia (4.8%, a difference of 0.87%), Immigrants from Lebanon (4.8%, a difference of 0.98%), and Immigrants from Serbia (4.9%, a difference of 1.1%).
| Demographics | Rating | Rank | Disability Age 5 to 17 |
| Immigrants | Uzbekistan | 100.0 /100 | #19 | Exceptional 4.8% |
| Burmese | 100.0 /100 | #20 | Exceptional 4.8% |
| Yup'ik | 100.0 /100 | #21 | Exceptional 4.8% |
| Asians | 100.0 /100 | #22 | Exceptional 4.8% |
| Immigrants | Bolivia | 100.0 /100 | #23 | Exceptional 4.8% |
| Immigrants | Lebanon | 100.0 /100 | #24 | Exceptional 4.8% |
| Immigrants | Asia | 100.0 /100 | #25 | Exceptional 4.8% |
| Bhutanese | 100.0 /100 | #26 | Exceptional 4.9% |
| Taiwanese | 100.0 /100 | #27 | Exceptional 4.9% |
| Immigrants | Japan | 100.0 /100 | #28 | Exceptional 4.9% |
| Immigrants | Serbia | 100.0 /100 | #29 | Exceptional 4.9% |
| Immigrants | Malaysia | 100.0 /100 | #30 | Exceptional 5.0% |
| Immigrants | Pakistan | 100.0 /100 | #31 | Exceptional 5.0% |
| Soviet Union | 100.0 /100 | #32 | Exceptional 5.0% |
| Immigrants | Indonesia | 100.0 /100 | #33 | Exceptional 5.0% |