Chickasaw vs Immigrants from Burma/Myanmar Unemployment Among Ages 20 to 24 years
COMPARE
Chickasaw
Immigrants from Burma/Myanmar
Unemployment Among Ages 20 to 24 years
Unemployment Among Ages 20 to 24 years Comparison
Chickasaw
Immigrants from Burma/Myanmar
9.9%
UNEMPLOYMENT AMONG AGES 20 TO 24 YEARS
98.4/ 100
METRIC RATING
77th/ 347
METRIC RANK
9.1%
UNEMPLOYMENT AMONG AGES 20 TO 24 YEARS
100.0/ 100
METRIC RATING
6th/ 347
METRIC RANK
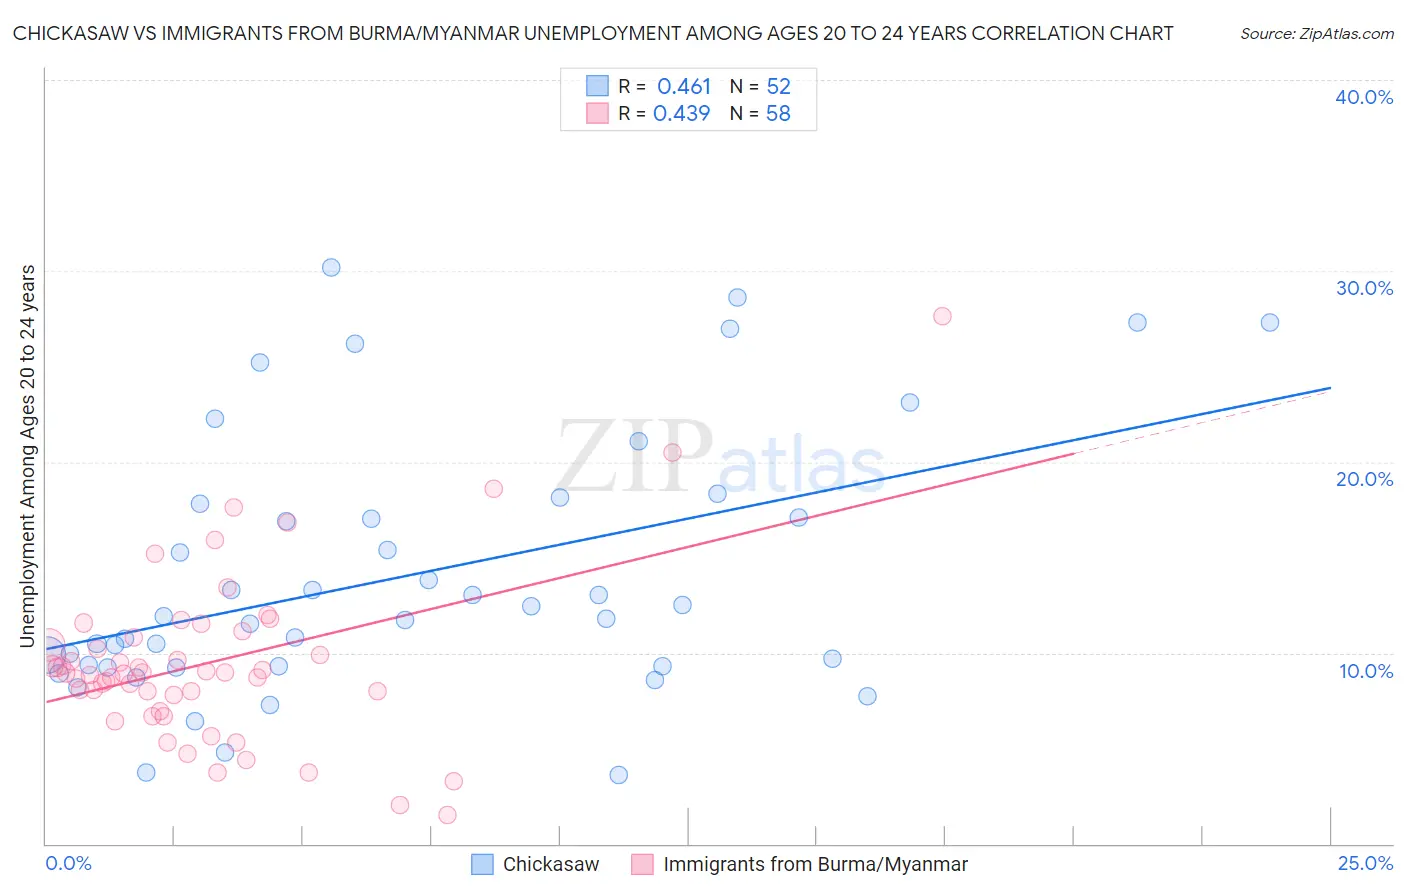
Chickasaw vs Immigrants from Burma/Myanmar Unemployment Among Ages 20 to 24 years Correlation Chart
The statistical analysis conducted on geographies consisting of 145,013,738 people shows a moderate positive correlation between the proportion of Chickasaw and unemployment rate among population between the ages 20 and 24 in the United States with a correlation coefficient (R) of 0.461 and weighted average of 9.9%. Similarly, the statistical analysis conducted on geographies consisting of 170,830,941 people shows a moderate positive correlation between the proportion of Immigrants from Burma/Myanmar and unemployment rate among population between the ages 20 and 24 in the United States with a correlation coefficient (R) of 0.439 and weighted average of 9.1%, a difference of 9.2%.
Unemployment Among Ages 20 to 24 years Correlation Summary
| Measurement | Chickasaw | Immigrants from Burma/Myanmar |
| Minimum | 3.6% | 1.5% |
| Maximum | 30.2% | 27.6% |
| Range | 26.6% | 26.1% |
| Mean | 14.0% | 9.5% |
| Median | 11.9% | 8.9% |
| Interquartile 25% (IQ1) | 9.3% | 7.8% |
| Interquartile 75% (IQ3) | 17.5% | 10.8% |
| Interquartile Range (IQR) | 8.2% | 3.0% |
| Standard Deviation (Sample) | 6.8% | 4.5% |
| Standard Deviation (Population) | 6.7% | 4.4% |
Similar Demographics by Unemployment Among Ages 20 to 24 years
Demographics Similar to Chickasaw by Unemployment Among Ages 20 to 24 years
In terms of unemployment among ages 20 to 24 years, the demographic groups most similar to Chickasaw are Czechoslovakian (9.9%, a difference of 0.020%), Assyrian/Chaldean/Syriac (9.9%, a difference of 0.030%), Icelander (9.9%, a difference of 0.050%), Immigrants from Netherlands (9.9%, a difference of 0.10%), and Immigrants from Australia (9.9%, a difference of 0.11%).
| Demographics | Rating | Rank | Unemployment Among Ages 20 to 24 years |
| Immigrants | Croatia | 99.0 /100 | #70 | Exceptional 9.9% |
| Celtics | 98.9 /100 | #71 | Exceptional 9.9% |
| Bolivians | 98.9 /100 | #72 | Exceptional 9.9% |
| Kenyans | 98.7 /100 | #73 | Exceptional 9.9% |
| Immigrants | Laos | 98.7 /100 | #74 | Exceptional 9.9% |
| Immigrants | Australia | 98.6 /100 | #75 | Exceptional 9.9% |
| Czechoslovakians | 98.4 /100 | #76 | Exceptional 9.9% |
| Chickasaw | 98.4 /100 | #77 | Exceptional 9.9% |
| Assyrians/Chaldeans/Syriacs | 98.3 /100 | #78 | Exceptional 9.9% |
| Icelanders | 98.3 /100 | #79 | Exceptional 9.9% |
| Immigrants | Netherlands | 98.2 /100 | #80 | Exceptional 9.9% |
| Yaqui | 98.0 /100 | #81 | Exceptional 9.9% |
| Sri Lankans | 98.0 /100 | #82 | Exceptional 9.9% |
| Immigrants | Bulgaria | 98.0 /100 | #83 | Exceptional 9.9% |
| Latvians | 97.9 /100 | #84 | Exceptional 9.9% |
Demographics Similar to Immigrants from Burma/Myanmar by Unemployment Among Ages 20 to 24 years
In terms of unemployment among ages 20 to 24 years, the demographic groups most similar to Immigrants from Burma/Myanmar are Luxembourger (9.1%, a difference of 0.36%), Somali (9.1%, a difference of 0.38%), Norwegian (9.0%, a difference of 0.60%), Immigrants from Somalia (9.2%, a difference of 0.73%), and Venezuelan (9.0%, a difference of 0.82%).
| Demographics | Rating | Rank | Unemployment Among Ages 20 to 24 years |
| Immigrants | Cuba | 100.0 /100 | #1 | Exceptional 8.7% |
| Immigrants | Venezuela | 100.0 /100 | #2 | Exceptional 8.9% |
| Indonesians | 100.0 /100 | #3 | Exceptional 9.0% |
| Venezuelans | 100.0 /100 | #4 | Exceptional 9.0% |
| Norwegians | 100.0 /100 | #5 | Exceptional 9.0% |
| Immigrants | Burma/Myanmar | 100.0 /100 | #6 | Exceptional 9.1% |
| Luxembourgers | 100.0 /100 | #7 | Exceptional 9.1% |
| Somalis | 100.0 /100 | #8 | Exceptional 9.1% |
| Immigrants | Somalia | 100.0 /100 | #9 | Exceptional 9.2% |
| Sudanese | 100.0 /100 | #10 | Exceptional 9.2% |
| Zimbabweans | 100.0 /100 | #11 | Exceptional 9.2% |
| Cubans | 100.0 /100 | #12 | Exceptional 9.2% |
| Immigrants | Congo | 100.0 /100 | #13 | Exceptional 9.2% |
| Slovenes | 100.0 /100 | #14 | Exceptional 9.3% |
| Immigrants | Sudan | 100.0 /100 | #15 | Exceptional 9.3% |