Chickasaw vs Immigrants from Ecuador Vision Disability
COMPARE
Chickasaw
Immigrants from Ecuador
Vision Disability
Vision Disability Comparison
Chickasaw
Immigrants from Ecuador
3.2%
VISION DISABILITY
0.0/ 100
METRIC RATING
338th/ 347
METRIC RANK
2.3%
VISION DISABILITY
2.0/ 100
METRIC RATING
231st/ 347
METRIC RANK
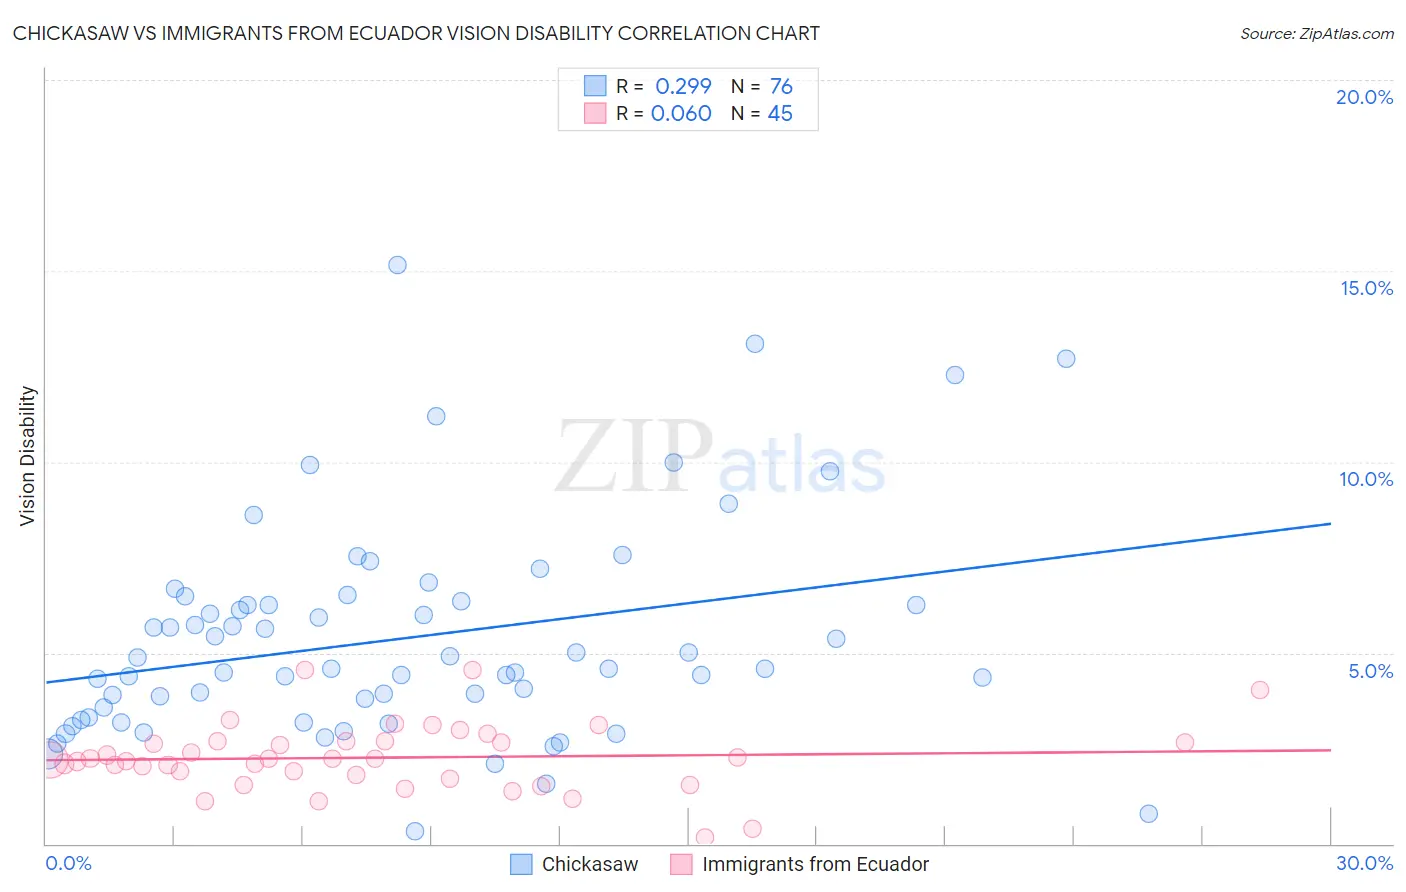
Chickasaw vs Immigrants from Ecuador Vision Disability Correlation Chart
The statistical analysis conducted on geographies consisting of 147,658,152 people shows a weak positive correlation between the proportion of Chickasaw and percentage of population with vision disability in the United States with a correlation coefficient (R) of 0.299 and weighted average of 3.2%. Similarly, the statistical analysis conducted on geographies consisting of 270,800,237 people shows a slight positive correlation between the proportion of Immigrants from Ecuador and percentage of population with vision disability in the United States with a correlation coefficient (R) of 0.060 and weighted average of 2.3%, a difference of 38.3%.
Vision Disability Correlation Summary
| Measurement | Chickasaw | Immigrants from Ecuador |
| Minimum | 0.33% | 0.16% |
| Maximum | 15.2% | 4.6% |
| Range | 14.8% | 4.4% |
| Mean | 5.4% | 2.3% |
| Median | 4.6% | 2.2% |
| Interquartile 25% (IQ1) | 3.5% | 1.8% |
| Interquartile 75% (IQ3) | 6.3% | 2.7% |
| Interquartile Range (IQR) | 2.9% | 0.94% |
| Standard Deviation (Sample) | 2.8% | 0.89% |
| Standard Deviation (Population) | 2.8% | 0.88% |
Similar Demographics by Vision Disability
Demographics Similar to Chickasaw by Vision Disability
In terms of vision disability, the demographic groups most similar to Chickasaw are Tsimshian (3.2%, a difference of 0.69%), Creek (3.2%, a difference of 0.82%), Dutch West Indian (3.2%, a difference of 0.91%), Alaskan Athabascan (3.1%, a difference of 0.93%), and Navajo (3.1%, a difference of 1.1%).
| Demographics | Rating | Rank | Vision Disability |
| Central American Indians | 0.0 /100 | #331 | Tragic 3.0% |
| Seminole | 0.0 /100 | #332 | Tragic 3.1% |
| Cajuns | 0.0 /100 | #333 | Tragic 3.1% |
| Cheyenne | 0.0 /100 | #334 | Tragic 3.1% |
| Navajo | 0.0 /100 | #335 | Tragic 3.1% |
| Alaskan Athabascans | 0.0 /100 | #336 | Tragic 3.1% |
| Dutch West Indians | 0.0 /100 | #337 | Tragic 3.2% |
| Chickasaw | 0.0 /100 | #338 | Tragic 3.2% |
| Tsimshian | 0.0 /100 | #339 | Tragic 3.2% |
| Creek | 0.0 /100 | #340 | Tragic 3.2% |
| Kiowa | 0.0 /100 | #341 | Tragic 3.3% |
| Choctaw | 0.0 /100 | #342 | Tragic 3.3% |
| Pima | 0.0 /100 | #343 | Tragic 3.3% |
| Pueblo | 0.0 /100 | #344 | Tragic 3.3% |
| Lumbee | 0.0 /100 | #345 | Tragic 3.4% |
Demographics Similar to Immigrants from Ecuador by Vision Disability
In terms of vision disability, the demographic groups most similar to Immigrants from Ecuador are Nicaraguan (2.3%, a difference of 0.16%), German Russian (2.3%, a difference of 0.19%), Central American (2.3%, a difference of 0.20%), Welsh (2.3%, a difference of 0.23%), and Hmong (2.3%, a difference of 0.31%).
| Demographics | Rating | Rank | Vision Disability |
| Irish | 3.4 /100 | #224 | Tragic 2.3% |
| Immigrants | Western Africa | 3.4 /100 | #225 | Tragic 2.3% |
| Immigrants | Germany | 3.0 /100 | #226 | Tragic 2.3% |
| Hawaiians | 2.9 /100 | #227 | Tragic 2.3% |
| Hmong | 2.5 /100 | #228 | Tragic 2.3% |
| Welsh | 2.3 /100 | #229 | Tragic 2.3% |
| Nicaraguans | 2.2 /100 | #230 | Tragic 2.3% |
| Immigrants | Ecuador | 2.0 /100 | #231 | Tragic 2.3% |
| German Russians | 1.8 /100 | #232 | Tragic 2.3% |
| Central Americans | 1.8 /100 | #233 | Tragic 2.3% |
| Scottish | 1.6 /100 | #234 | Tragic 2.3% |
| Marshallese | 1.5 /100 | #235 | Tragic 2.3% |
| Immigrants | Congo | 1.4 /100 | #236 | Tragic 2.3% |
| Immigrants | Portugal | 1.4 /100 | #237 | Tragic 2.3% |
| Immigrants | Cambodia | 1.1 /100 | #238 | Tragic 2.3% |