Chickasaw vs Peruvian Vision Disability
COMPARE
Chickasaw
Peruvian
Vision Disability
Vision Disability Comparison
Chickasaw
Peruvians
3.2%
VISION DISABILITY
0.0/ 100
METRIC RATING
338th/ 347
METRIC RANK
2.1%
VISION DISABILITY
93.5/ 100
METRIC RATING
111th/ 347
METRIC RANK
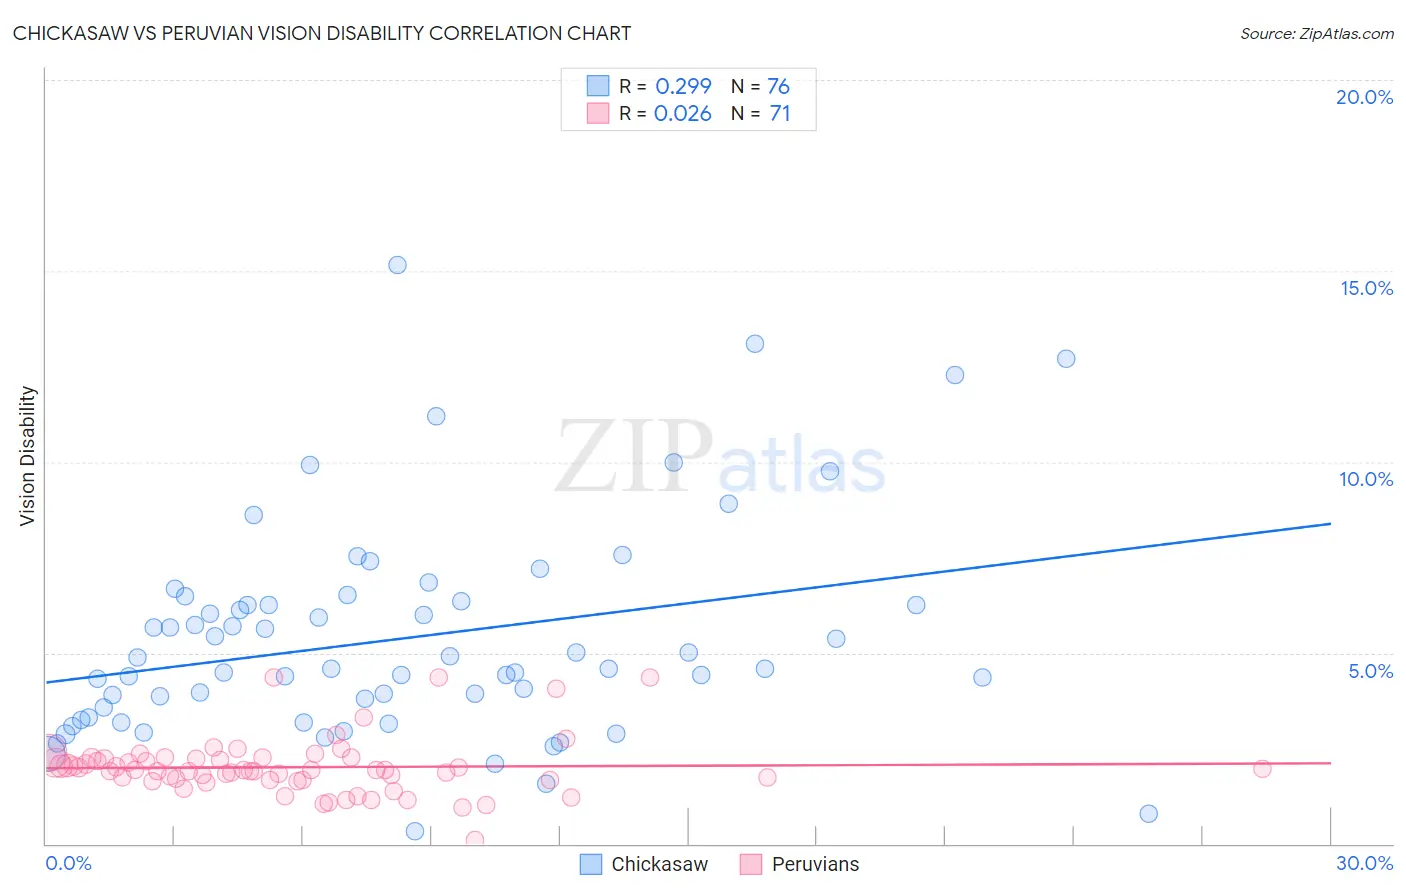
Chickasaw vs Peruvian Vision Disability Correlation Chart
The statistical analysis conducted on geographies consisting of 147,658,152 people shows a weak positive correlation between the proportion of Chickasaw and percentage of population with vision disability in the United States with a correlation coefficient (R) of 0.299 and weighted average of 3.2%. Similarly, the statistical analysis conducted on geographies consisting of 363,040,425 people shows no correlation between the proportion of Peruvians and percentage of population with vision disability in the United States with a correlation coefficient (R) of 0.026 and weighted average of 2.1%, a difference of 53.2%.
Vision Disability Correlation Summary
| Measurement | Chickasaw | Peruvian |
| Minimum | 0.33% | 0.11% |
| Maximum | 15.2% | 4.4% |
| Range | 14.8% | 4.3% |
| Mean | 5.4% | 2.0% |
| Median | 4.6% | 1.9% |
| Interquartile 25% (IQ1) | 3.5% | 1.7% |
| Interquartile 75% (IQ3) | 6.3% | 2.2% |
| Interquartile Range (IQR) | 2.9% | 0.56% |
| Standard Deviation (Sample) | 2.8% | 0.75% |
| Standard Deviation (Population) | 2.8% | 0.74% |
Similar Demographics by Vision Disability
Demographics Similar to Chickasaw by Vision Disability
In terms of vision disability, the demographic groups most similar to Chickasaw are Tsimshian (3.2%, a difference of 0.69%), Creek (3.2%, a difference of 0.82%), Dutch West Indian (3.2%, a difference of 0.91%), Alaskan Athabascan (3.1%, a difference of 0.93%), and Navajo (3.1%, a difference of 1.1%).
| Demographics | Rating | Rank | Vision Disability |
| Central American Indians | 0.0 /100 | #331 | Tragic 3.0% |
| Seminole | 0.0 /100 | #332 | Tragic 3.1% |
| Cajuns | 0.0 /100 | #333 | Tragic 3.1% |
| Cheyenne | 0.0 /100 | #334 | Tragic 3.1% |
| Navajo | 0.0 /100 | #335 | Tragic 3.1% |
| Alaskan Athabascans | 0.0 /100 | #336 | Tragic 3.1% |
| Dutch West Indians | 0.0 /100 | #337 | Tragic 3.2% |
| Chickasaw | 0.0 /100 | #338 | Tragic 3.2% |
| Tsimshian | 0.0 /100 | #339 | Tragic 3.2% |
| Creek | 0.0 /100 | #340 | Tragic 3.2% |
| Kiowa | 0.0 /100 | #341 | Tragic 3.3% |
| Choctaw | 0.0 /100 | #342 | Tragic 3.3% |
| Pima | 0.0 /100 | #343 | Tragic 3.3% |
| Pueblo | 0.0 /100 | #344 | Tragic 3.3% |
| Lumbee | 0.0 /100 | #345 | Tragic 3.4% |
Demographics Similar to Peruvians by Vision Disability
In terms of vision disability, the demographic groups most similar to Peruvians are Immigrants from Armenia (2.1%, a difference of 0.060%), Chilean (2.1%, a difference of 0.13%), Korean (2.1%, a difference of 0.15%), Immigrants from Denmark (2.1%, a difference of 0.16%), and Danish (2.1%, a difference of 0.17%).
| Demographics | Rating | Rank | Vision Disability |
| Immigrants | Italy | 94.4 /100 | #104 | Exceptional 2.1% |
| Carpatho Rusyns | 94.3 /100 | #105 | Exceptional 2.1% |
| Swedes | 94.2 /100 | #106 | Exceptional 2.1% |
| Danes | 94.2 /100 | #107 | Exceptional 2.1% |
| Koreans | 94.1 /100 | #108 | Exceptional 2.1% |
| Chileans | 94.0 /100 | #109 | Exceptional 2.1% |
| Immigrants | Armenia | 93.8 /100 | #110 | Exceptional 2.1% |
| Peruvians | 93.5 /100 | #111 | Exceptional 2.1% |
| Immigrants | Denmark | 92.9 /100 | #112 | Exceptional 2.1% |
| Kenyans | 92.5 /100 | #113 | Exceptional 2.1% |
| Croatians | 92.3 /100 | #114 | Exceptional 2.1% |
| Immigrants | Vietnam | 92.2 /100 | #115 | Exceptional 2.1% |
| Ugandans | 92.2 /100 | #116 | Exceptional 2.1% |
| Poles | 92.0 /100 | #117 | Exceptional 2.1% |
| Immigrants | Philippines | 91.4 /100 | #118 | Exceptional 2.1% |