Palestinian vs Crow Hearing Disability
COMPARE
Palestinian
Crow
Hearing Disability
Hearing Disability Comparison
Palestinians
Crow
2.9%
HEARING DISABILITY
73.6/ 100
METRIC RATING
150th/ 347
METRIC RANK
4.2%
HEARING DISABILITY
0.0/ 100
METRIC RATING
329th/ 347
METRIC RANK
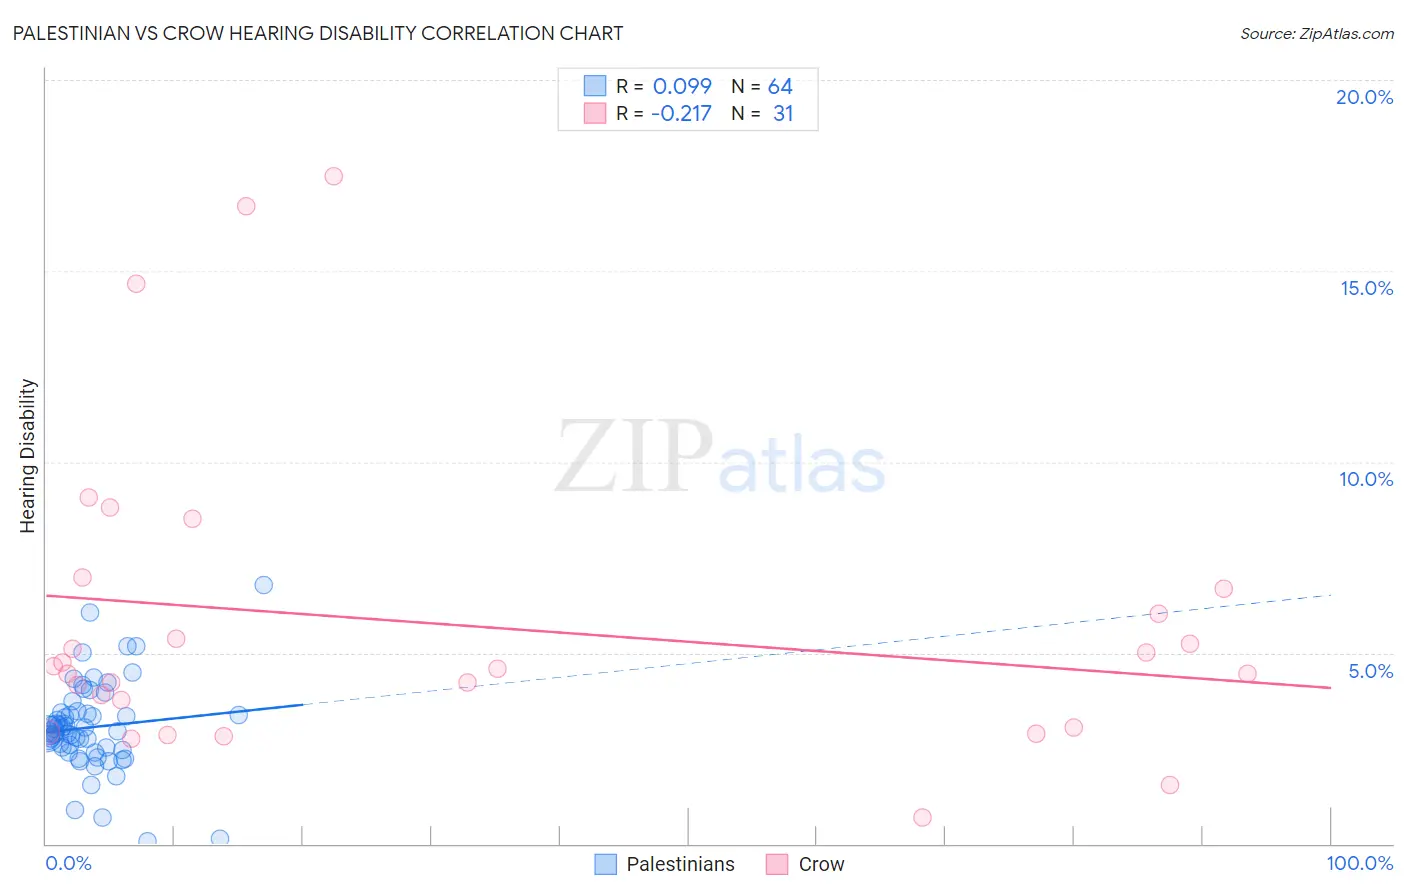
Palestinian vs Crow Hearing Disability Correlation Chart
The statistical analysis conducted on geographies consisting of 216,454,064 people shows a slight positive correlation between the proportion of Palestinians and percentage of population with hearing disability in the United States with a correlation coefficient (R) of 0.099 and weighted average of 2.9%. Similarly, the statistical analysis conducted on geographies consisting of 59,194,968 people shows a weak negative correlation between the proportion of Crow and percentage of population with hearing disability in the United States with a correlation coefficient (R) of -0.217 and weighted average of 4.2%, a difference of 42.5%.
Hearing Disability Correlation Summary
| Measurement | Palestinian | Crow |
| Minimum | 0.070% | 0.69% |
| Maximum | 6.8% | 17.5% |
| Range | 6.7% | 16.8% |
| Mean | 3.0% | 5.7% |
| Median | 2.9% | 4.6% |
| Interquartile 25% (IQ1) | 2.5% | 3.1% |
| Interquartile 75% (IQ3) | 3.4% | 6.7% |
| Interquartile Range (IQR) | 0.93% | 3.6% |
| Standard Deviation (Sample) | 1.2% | 4.0% |
| Standard Deviation (Population) | 1.2% | 3.9% |
Similar Demographics by Hearing Disability
Demographics Similar to Palestinians by Hearing Disability
In terms of hearing disability, the demographic groups most similar to Palestinians are Immigrants from France (2.9%, a difference of 0.060%), Immigrants from Lithuania (2.9%, a difference of 0.070%), Sudanese (2.9%, a difference of 0.18%), Immigrants from Lebanon (2.9%, a difference of 0.25%), and Costa Rican (2.9%, a difference of 0.27%).
| Demographics | Rating | Rank | Hearing Disability |
| Immigrants | Bahamas | 80.9 /100 | #143 | Excellent 2.9% |
| Immigrants | Bulgaria | 79.2 /100 | #144 | Good 2.9% |
| Immigrants | Congo | 78.9 /100 | #145 | Good 2.9% |
| Brazilians | 78.7 /100 | #146 | Good 2.9% |
| Tongans | 78.6 /100 | #147 | Good 2.9% |
| Immigrants | Russia | 77.7 /100 | #148 | Good 2.9% |
| Immigrants | Panama | 76.9 /100 | #149 | Good 2.9% |
| Palestinians | 73.6 /100 | #150 | Good 2.9% |
| Immigrants | France | 73.1 /100 | #151 | Good 2.9% |
| Immigrants | Lithuania | 73.0 /100 | #152 | Good 2.9% |
| Sudanese | 72.1 /100 | #153 | Good 2.9% |
| Immigrants | Lebanon | 71.5 /100 | #154 | Good 2.9% |
| Costa Ricans | 71.4 /100 | #155 | Good 2.9% |
| Immigrants | Poland | 70.2 /100 | #156 | Good 2.9% |
| Immigrants | Kazakhstan | 69.6 /100 | #157 | Good 2.9% |
Demographics Similar to Crow by Hearing Disability
In terms of hearing disability, the demographic groups most similar to Crow are Tohono O'odham (4.2%, a difference of 0.010%), Arapaho (4.1%, a difference of 0.39%), Native/Alaskan (4.2%, a difference of 0.79%), Cherokee (4.2%, a difference of 0.94%), and Potawatomi (4.1%, a difference of 1.1%).
| Demographics | Rating | Rank | Hearing Disability |
| Seminole | 0.0 /100 | #322 | Tragic 4.1% |
| Apache | 0.0 /100 | #323 | Tragic 4.1% |
| Osage | 0.0 /100 | #324 | Tragic 4.1% |
| Lumbee | 0.0 /100 | #325 | Tragic 4.1% |
| Potawatomi | 0.0 /100 | #326 | Tragic 4.1% |
| Arapaho | 0.0 /100 | #327 | Tragic 4.1% |
| Tohono O'odham | 0.0 /100 | #328 | Tragic 4.2% |
| Crow | 0.0 /100 | #329 | Tragic 4.2% |
| Natives/Alaskans | 0.0 /100 | #330 | Tragic 4.2% |
| Cherokee | 0.0 /100 | #331 | Tragic 4.2% |
| Houma | 0.0 /100 | #332 | Tragic 4.2% |
| Dutch West Indians | 0.0 /100 | #333 | Tragic 4.3% |
| Aleuts | 0.0 /100 | #334 | Tragic 4.3% |
| Kiowa | 0.0 /100 | #335 | Tragic 4.3% |
| Creek | 0.0 /100 | #336 | Tragic 4.4% |