Pueblo vs Crow Hearing Disability
COMPARE
Pueblo
Crow
Hearing Disability
Hearing Disability Comparison
Pueblo
Crow
4.6%
HEARING DISABILITY
0.0/ 100
METRIC RATING
340th/ 347
METRIC RANK
4.2%
HEARING DISABILITY
0.0/ 100
METRIC RATING
329th/ 347
METRIC RANK
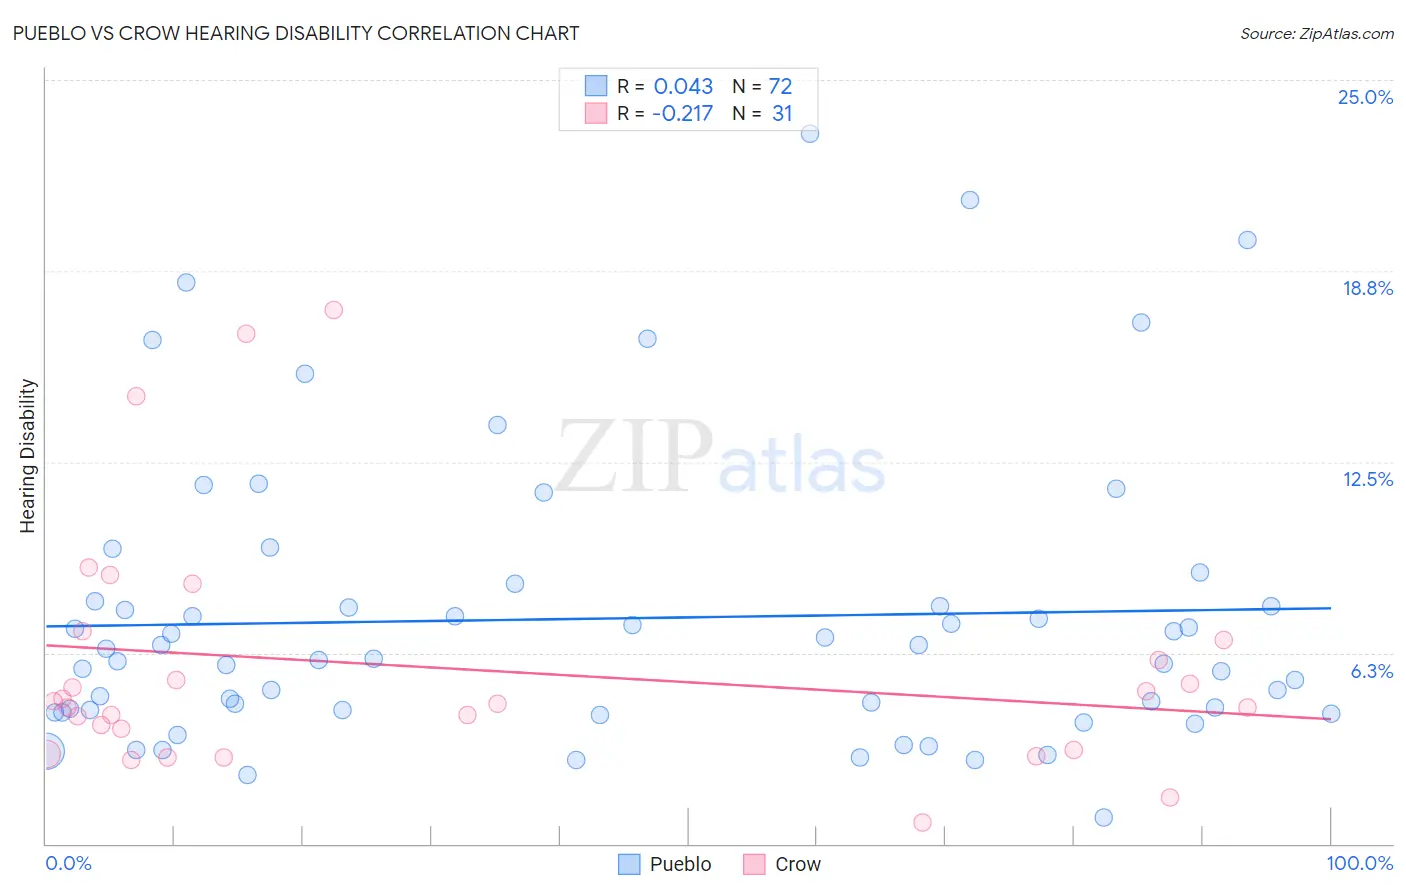
Pueblo vs Crow Hearing Disability Correlation Chart
The statistical analysis conducted on geographies consisting of 120,073,989 people shows no correlation between the proportion of Pueblo and percentage of population with hearing disability in the United States with a correlation coefficient (R) of 0.043 and weighted average of 4.6%. Similarly, the statistical analysis conducted on geographies consisting of 59,194,968 people shows a weak negative correlation between the proportion of Crow and percentage of population with hearing disability in the United States with a correlation coefficient (R) of -0.217 and weighted average of 4.2%, a difference of 10.9%.
Hearing Disability Correlation Summary
| Measurement | Pueblo | Crow |
| Minimum | 0.85% | 0.69% |
| Maximum | 23.2% | 17.5% |
| Range | 22.4% | 16.8% |
| Mean | 7.4% | 5.7% |
| Median | 6.0% | 4.6% |
| Interquartile 25% (IQ1) | 4.3% | 3.1% |
| Interquartile 75% (IQ3) | 7.8% | 6.7% |
| Interquartile Range (IQR) | 3.5% | 3.6% |
| Standard Deviation (Sample) | 4.7% | 4.0% |
| Standard Deviation (Population) | 4.7% | 3.9% |
Demographics Similar to Pueblo and Crow by Hearing Disability
In terms of hearing disability, the demographic groups most similar to Pueblo are Navajo (4.6%, a difference of 0.33%), Choctaw (4.5%, a difference of 1.5%), Tsimshian (4.7%, a difference of 1.9%), Inupiat (4.7%, a difference of 2.1%), and Alaska Native (4.5%, a difference of 2.9%). Similarly, the demographic groups most similar to Crow are Tohono O'odham (4.2%, a difference of 0.010%), Arapaho (4.1%, a difference of 0.39%), Native/Alaskan (4.2%, a difference of 0.79%), Cherokee (4.2%, a difference of 0.94%), and Potawatomi (4.1%, a difference of 1.1%).
| Demographics | Rating | Rank | Hearing Disability |
| Osage | 0.0 /100 | #324 | Tragic 4.1% |
| Lumbee | 0.0 /100 | #325 | Tragic 4.1% |
| Potawatomi | 0.0 /100 | #326 | Tragic 4.1% |
| Arapaho | 0.0 /100 | #327 | Tragic 4.1% |
| Tohono O'odham | 0.0 /100 | #328 | Tragic 4.2% |
| Crow | 0.0 /100 | #329 | Tragic 4.2% |
| Natives/Alaskans | 0.0 /100 | #330 | Tragic 4.2% |
| Cherokee | 0.0 /100 | #331 | Tragic 4.2% |
| Houma | 0.0 /100 | #332 | Tragic 4.2% |
| Dutch West Indians | 0.0 /100 | #333 | Tragic 4.3% |
| Aleuts | 0.0 /100 | #334 | Tragic 4.3% |
| Kiowa | 0.0 /100 | #335 | Tragic 4.3% |
| Creek | 0.0 /100 | #336 | Tragic 4.4% |
| Chickasaw | 0.0 /100 | #337 | Tragic 4.5% |
| Alaska Natives | 0.0 /100 | #338 | Tragic 4.5% |
| Choctaw | 0.0 /100 | #339 | Tragic 4.5% |
| Pueblo | 0.0 /100 | #340 | Tragic 4.6% |
| Navajo | 0.0 /100 | #341 | Tragic 4.6% |
| Tsimshian | 0.0 /100 | #342 | Tragic 4.7% |
| Inupiat | 0.0 /100 | #343 | Tragic 4.7% |
| Tlingit-Haida | 0.0 /100 | #344 | Tragic 4.8% |