Immigrants from Morocco vs Bhutanese Disability Age 5 to 17
COMPARE
Immigrants from Morocco
Bhutanese
Disability Age 5 to 17
Disability Age 5 to 17 Comparison
Immigrants from Morocco
Bhutanese
5.8%
DISABILITY AGE 5 TO 17
8.3/ 100
METRIC RATING
214th/ 347
METRIC RANK
4.9%
DISABILITY AGE 5 TO 17
100.0/ 100
METRIC RATING
26th/ 347
METRIC RANK
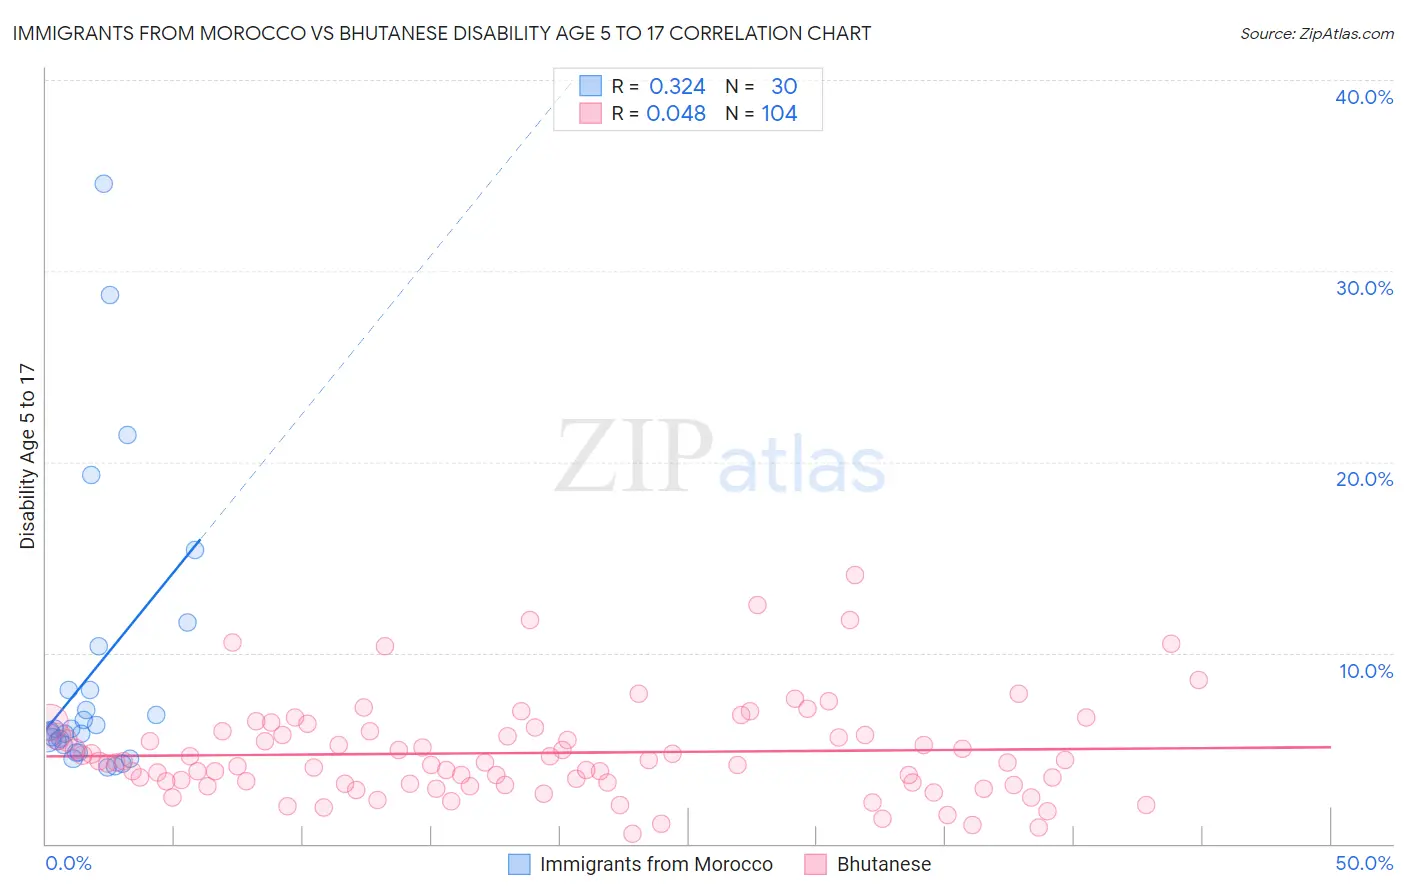
Immigrants from Morocco vs Bhutanese Disability Age 5 to 17 Correlation Chart
The statistical analysis conducted on geographies consisting of 178,475,877 people shows a mild positive correlation between the proportion of Immigrants from Morocco and percentage of population with a disability between the ages 5 and 17 in the United States with a correlation coefficient (R) of 0.324 and weighted average of 5.8%. Similarly, the statistical analysis conducted on geographies consisting of 450,824,521 people shows no correlation between the proportion of Bhutanese and percentage of population with a disability between the ages 5 and 17 in the United States with a correlation coefficient (R) of 0.048 and weighted average of 4.9%, a difference of 17.8%.
Disability Age 5 to 17 Correlation Summary
| Measurement | Immigrants from Morocco | Bhutanese |
| Minimum | 4.0% | 0.55% |
| Maximum | 34.6% | 14.1% |
| Range | 30.6% | 13.6% |
| Mean | 9.0% | 4.8% |
| Median | 6.0% | 4.3% |
| Interquartile 25% (IQ1) | 5.2% | 3.1% |
| Interquartile 75% (IQ3) | 8.0% | 5.8% |
| Interquartile Range (IQR) | 2.9% | 2.7% |
| Standard Deviation (Sample) | 7.5% | 2.5% |
| Standard Deviation (Population) | 7.4% | 2.5% |
Similar Demographics by Disability Age 5 to 17
Demographics Similar to Immigrants from Morocco by Disability Age 5 to 17
In terms of disability age 5 to 17, the demographic groups most similar to Immigrants from Morocco are Immigrants from Cameroon (5.8%, a difference of 0.0%), Swedish (5.8%, a difference of 0.040%), Immigrants from Panama (5.8%, a difference of 0.050%), Yugoslavian (5.8%, a difference of 0.12%), and Nigerian (5.8%, a difference of 0.13%).
| Demographics | Rating | Rank | Disability Age 5 to 17 |
| Moroccans | 10.4 /100 | #207 | Poor 5.7% |
| Kenyans | 10.0 /100 | #208 | Poor 5.8% |
| Immigrants | Uganda | 9.7 /100 | #209 | Tragic 5.8% |
| Immigrants | Haiti | 9.5 /100 | #210 | Tragic 5.8% |
| Yugoslavians | 9.1 /100 | #211 | Tragic 5.8% |
| Immigrants | Panama | 8.7 /100 | #212 | Tragic 5.8% |
| Immigrants | Cameroon | 8.3 /100 | #213 | Tragic 5.8% |
| Immigrants | Morocco | 8.3 /100 | #214 | Tragic 5.8% |
| Swedes | 8.1 /100 | #215 | Tragic 5.8% |
| Nigerians | 7.5 /100 | #216 | Tragic 5.8% |
| Czechs | 7.4 /100 | #217 | Tragic 5.8% |
| Immigrants | Sierra Leone | 7.1 /100 | #218 | Tragic 5.8% |
| Sierra Leoneans | 7.0 /100 | #219 | Tragic 5.8% |
| Belgians | 6.9 /100 | #220 | Tragic 5.8% |
| Lithuanians | 6.7 /100 | #221 | Tragic 5.8% |
Demographics Similar to Bhutanese by Disability Age 5 to 17
In terms of disability age 5 to 17, the demographic groups most similar to Bhutanese are Taiwanese (4.9%, a difference of 0.56%), Immigrants from Japan (4.9%, a difference of 0.64%), Immigrants from Asia (4.8%, a difference of 0.87%), Immigrants from Lebanon (4.8%, a difference of 0.98%), and Immigrants from Serbia (4.9%, a difference of 1.1%).
| Demographics | Rating | Rank | Disability Age 5 to 17 |
| Immigrants | Uzbekistan | 100.0 /100 | #19 | Exceptional 4.8% |
| Burmese | 100.0 /100 | #20 | Exceptional 4.8% |
| Yup'ik | 100.0 /100 | #21 | Exceptional 4.8% |
| Asians | 100.0 /100 | #22 | Exceptional 4.8% |
| Immigrants | Bolivia | 100.0 /100 | #23 | Exceptional 4.8% |
| Immigrants | Lebanon | 100.0 /100 | #24 | Exceptional 4.8% |
| Immigrants | Asia | 100.0 /100 | #25 | Exceptional 4.8% |
| Bhutanese | 100.0 /100 | #26 | Exceptional 4.9% |
| Taiwanese | 100.0 /100 | #27 | Exceptional 4.9% |
| Immigrants | Japan | 100.0 /100 | #28 | Exceptional 4.9% |
| Immigrants | Serbia | 100.0 /100 | #29 | Exceptional 4.9% |
| Immigrants | Malaysia | 100.0 /100 | #30 | Exceptional 5.0% |
| Immigrants | Pakistan | 100.0 /100 | #31 | Exceptional 5.0% |
| Soviet Union | 100.0 /100 | #32 | Exceptional 5.0% |
| Immigrants | Indonesia | 100.0 /100 | #33 | Exceptional 5.0% |