Zimbabwean vs Nepalese Self-Care Disability
COMPARE
Zimbabwean
Nepalese
Self-Care Disability
Self-Care Disability Comparison
Zimbabweans
Nepalese
2.2%
SELF-CARE DISABILITY
100.0/ 100
METRIC RATING
5th/ 347
METRIC RANK
3.0%
SELF-CARE DISABILITY
0.0/ 100
METRIC RATING
330th/ 347
METRIC RANK
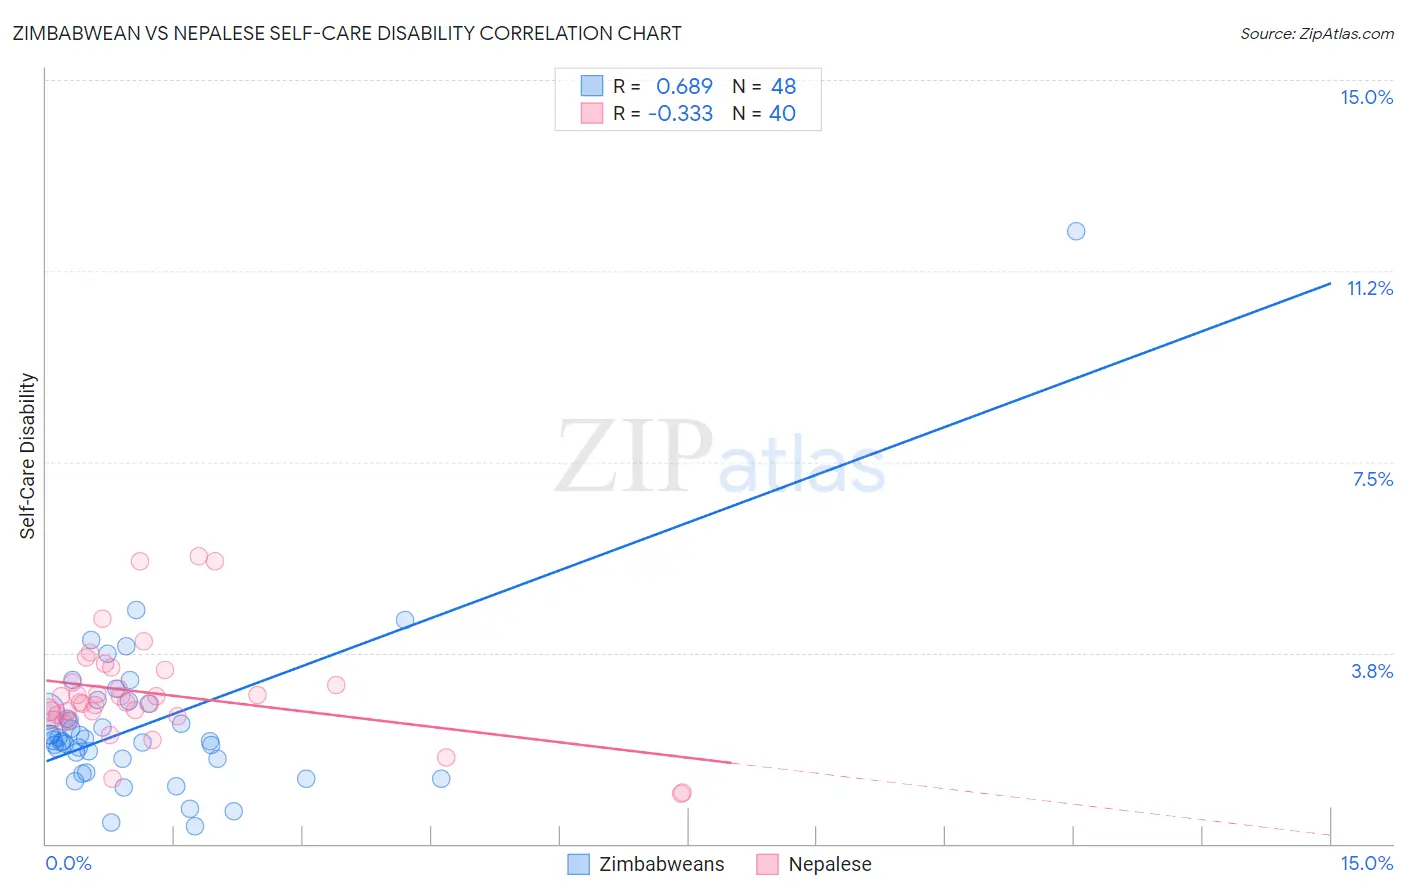
Zimbabwean vs Nepalese Self-Care Disability Correlation Chart
The statistical analysis conducted on geographies consisting of 69,189,225 people shows a significant positive correlation between the proportion of Zimbabweans and percentage of population with self-care disability in the United States with a correlation coefficient (R) of 0.689 and weighted average of 2.2%. Similarly, the statistical analysis conducted on geographies consisting of 24,515,553 people shows a mild negative correlation between the proportion of Nepalese and percentage of population with self-care disability in the United States with a correlation coefficient (R) of -0.333 and weighted average of 3.0%, a difference of 37.8%.
Self-Care Disability Correlation Summary
| Measurement | Zimbabwean | Nepalese |
| Minimum | 0.34% | 0.99% |
| Maximum | 12.0% | 5.6% |
| Range | 11.7% | 4.7% |
| Mean | 2.4% | 3.0% |
| Median | 2.0% | 2.8% |
| Interquartile 25% (IQ1) | 1.7% | 2.5% |
| Interquartile 75% (IQ3) | 2.7% | 3.3% |
| Interquartile Range (IQR) | 1.0% | 0.76% |
| Standard Deviation (Sample) | 1.7% | 1.0% |
| Standard Deviation (Population) | 1.7% | 1.0% |
Similar Demographics by Self-Care Disability
Demographics Similar to Zimbabweans by Self-Care Disability
In terms of self-care disability, the demographic groups most similar to Zimbabweans are Filipino (2.2%, a difference of 0.25%), Immigrants from Bolivia (2.2%, a difference of 0.46%), Bolivian (2.2%, a difference of 0.51%), Immigrants from Nepal (2.2%, a difference of 0.64%), and Immigrants from Singapore (2.1%, a difference of 0.98%).
| Demographics | Rating | Rank | Self-Care Disability |
| Yup'ik | 100.0 /100 | #1 | Exceptional 1.9% |
| Immigrants | India | 100.0 /100 | #2 | Exceptional 2.0% |
| Thais | 100.0 /100 | #3 | Exceptional 2.1% |
| Immigrants | Singapore | 100.0 /100 | #4 | Exceptional 2.1% |
| Zimbabweans | 100.0 /100 | #5 | Exceptional 2.2% |
| Filipinos | 100.0 /100 | #6 | Exceptional 2.2% |
| Immigrants | Bolivia | 100.0 /100 | #7 | Exceptional 2.2% |
| Bolivians | 100.0 /100 | #8 | Exceptional 2.2% |
| Immigrants | Nepal | 100.0 /100 | #9 | Exceptional 2.2% |
| Sudanese | 100.0 /100 | #10 | Exceptional 2.2% |
| Immigrants | South Central Asia | 100.0 /100 | #11 | Exceptional 2.2% |
| Immigrants | Ethiopia | 100.0 /100 | #12 | Exceptional 2.2% |
| Ethiopians | 100.0 /100 | #13 | Exceptional 2.2% |
| Luxembourgers | 100.0 /100 | #14 | Exceptional 2.2% |
| Okinawans | 100.0 /100 | #15 | Exceptional 2.2% |
Demographics Similar to Nepalese by Self-Care Disability
In terms of self-care disability, the demographic groups most similar to Nepalese are Lumbee (3.0%, a difference of 0.12%), Kiowa (3.0%, a difference of 0.47%), Dutch West Indian (3.0%, a difference of 0.71%), Cajun (2.9%, a difference of 0.75%), and Houma (3.0%, a difference of 0.78%).
| Demographics | Rating | Rank | Self-Care Disability |
| Seminole | 0.0 /100 | #323 | Tragic 2.9% |
| Cherokee | 0.0 /100 | #324 | Tragic 2.9% |
| Immigrants | Uzbekistan | 0.0 /100 | #325 | Tragic 2.9% |
| Paiute | 0.0 /100 | #326 | Tragic 2.9% |
| Blacks/African Americans | 0.0 /100 | #327 | Tragic 2.9% |
| Hopi | 0.0 /100 | #328 | Tragic 2.9% |
| Cajuns | 0.0 /100 | #329 | Tragic 2.9% |
| Nepalese | 0.0 /100 | #330 | Tragic 3.0% |
| Lumbee | 0.0 /100 | #331 | Tragic 3.0% |
| Kiowa | 0.0 /100 | #332 | Tragic 3.0% |
| Dutch West Indians | 0.0 /100 | #333 | Tragic 3.0% |
| Houma | 0.0 /100 | #334 | Tragic 3.0% |
| Immigrants | Azores | 0.0 /100 | #335 | Tragic 3.0% |
| Immigrants | Yemen | 0.0 /100 | #336 | Tragic 3.0% |
| Choctaw | 0.0 /100 | #337 | Tragic 3.0% |