Cheyenne vs Immigrants from Philippines Hearing Disability
COMPARE
Cheyenne
Immigrants from Philippines
Hearing Disability
Hearing Disability Comparison
Cheyenne
Immigrants from Philippines
4.0%
HEARING DISABILITY
0.0/ 100
METRIC RATING
318th/ 347
METRIC RANK
3.0%
HEARING DISABILITY
46.4/ 100
METRIC RATING
177th/ 347
METRIC RANK
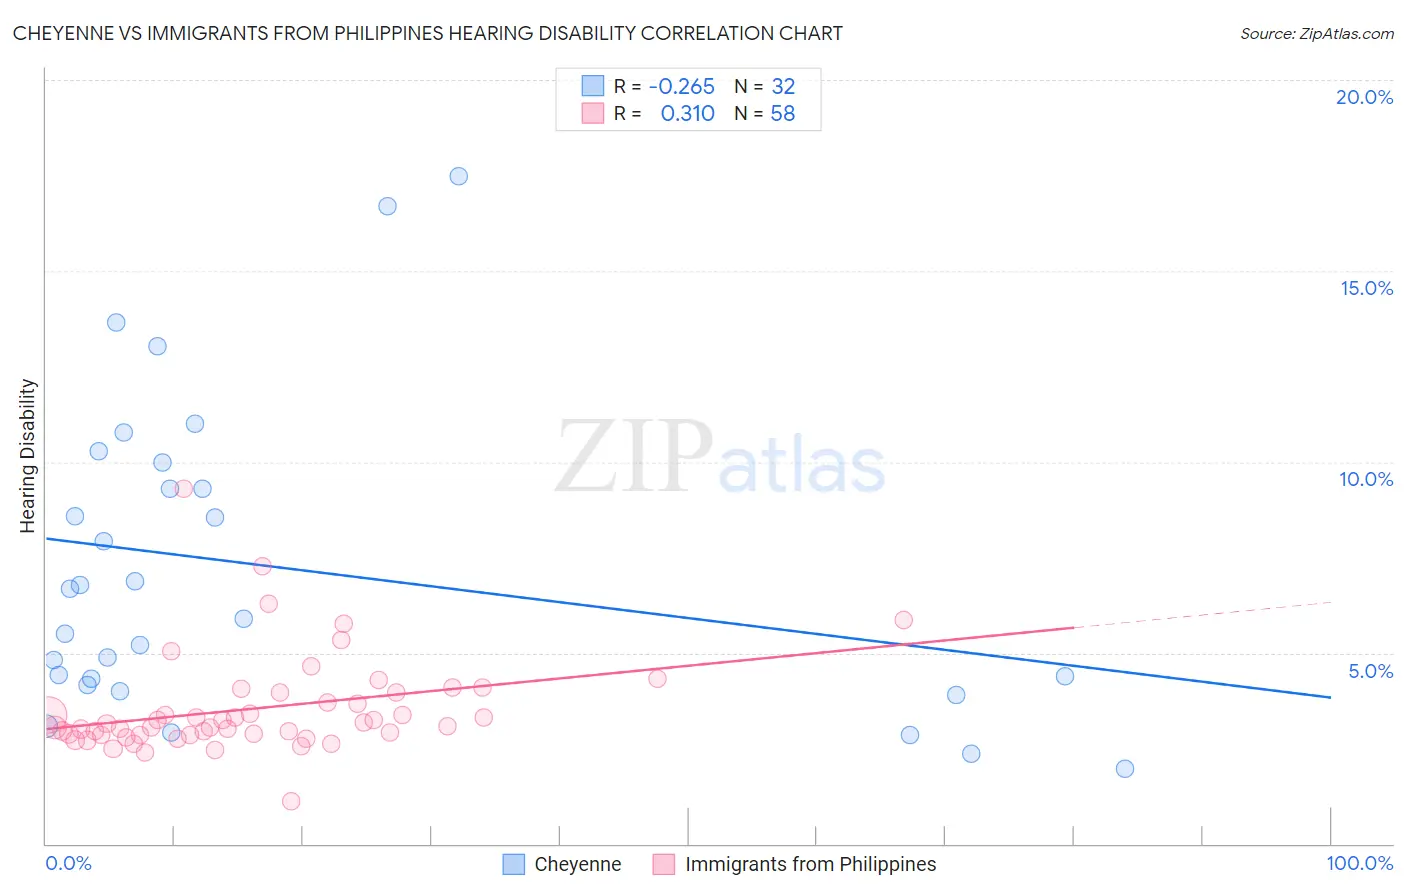
Cheyenne vs Immigrants from Philippines Hearing Disability Correlation Chart
The statistical analysis conducted on geographies consisting of 80,707,533 people shows a weak negative correlation between the proportion of Cheyenne and percentage of population with hearing disability in the United States with a correlation coefficient (R) of -0.265 and weighted average of 4.0%. Similarly, the statistical analysis conducted on geographies consisting of 471,004,648 people shows a mild positive correlation between the proportion of Immigrants from Philippines and percentage of population with hearing disability in the United States with a correlation coefficient (R) of 0.310 and weighted average of 3.0%, a difference of 32.0%.
Hearing Disability Correlation Summary
| Measurement | Cheyenne | Immigrants from Philippines |
| Minimum | 2.0% | 1.1% |
| Maximum | 17.5% | 9.3% |
| Range | 15.5% | 8.2% |
| Mean | 7.2% | 3.5% |
| Median | 6.3% | 3.1% |
| Interquartile 25% (IQ1) | 4.2% | 2.8% |
| Interquartile 75% (IQ3) | 9.6% | 4.0% |
| Interquartile Range (IQR) | 5.4% | 1.1% |
| Standard Deviation (Sample) | 4.0% | 1.3% |
| Standard Deviation (Population) | 4.0% | 1.3% |
Similar Demographics by Hearing Disability
Demographics Similar to Cheyenne by Hearing Disability
In terms of hearing disability, the demographic groups most similar to Cheyenne are Comanche (4.0%, a difference of 0.17%), Spanish American (4.0%, a difference of 0.31%), Puget Sound Salish (3.9%, a difference of 0.51%), Yakama (3.9%, a difference of 0.52%), and Chippewa (4.0%, a difference of 0.65%).
| Demographics | Rating | Rank | Hearing Disability |
| Americans | 0.0 /100 | #311 | Tragic 3.9% |
| Cajuns | 0.0 /100 | #312 | Tragic 3.9% |
| Hopi | 0.0 /100 | #313 | Tragic 3.9% |
| Yakama | 0.0 /100 | #314 | Tragic 3.9% |
| Puget Sound Salish | 0.0 /100 | #315 | Tragic 3.9% |
| Spanish Americans | 0.0 /100 | #316 | Tragic 4.0% |
| Comanche | 0.0 /100 | #317 | Tragic 4.0% |
| Cheyenne | 0.0 /100 | #318 | Tragic 4.0% |
| Chippewa | 0.0 /100 | #319 | Tragic 4.0% |
| Shoshone | 0.0 /100 | #320 | Tragic 4.0% |
| Paiute | 0.0 /100 | #321 | Tragic 4.1% |
| Seminole | 0.0 /100 | #322 | Tragic 4.1% |
| Apache | 0.0 /100 | #323 | Tragic 4.1% |
| Osage | 0.0 /100 | #324 | Tragic 4.1% |
| Lumbee | 0.0 /100 | #325 | Tragic 4.1% |
Demographics Similar to Immigrants from Philippines by Hearing Disability
In terms of hearing disability, the demographic groups most similar to Immigrants from Philippines are Japanese (3.0%, a difference of 0.040%), Panamanian (3.0%, a difference of 0.060%), Immigrants from Romania (3.0%, a difference of 0.20%), Immigrants from Moldova (3.0%, a difference of 0.31%), and Indonesian (3.0%, a difference of 0.34%).
| Demographics | Rating | Rank | Hearing Disability |
| Immigrants | Cabo Verde | 56.9 /100 | #170 | Average 3.0% |
| Immigrants | Ukraine | 56.6 /100 | #171 | Average 3.0% |
| Armenians | 56.0 /100 | #172 | Average 3.0% |
| Immigrants | Serbia | 51.1 /100 | #173 | Average 3.0% |
| Indonesians | 50.0 /100 | #174 | Average 3.0% |
| Immigrants | Romania | 48.4 /100 | #175 | Average 3.0% |
| Panamanians | 47.0 /100 | #176 | Average 3.0% |
| Immigrants | Philippines | 46.4 /100 | #177 | Average 3.0% |
| Japanese | 46.0 /100 | #178 | Average 3.0% |
| Immigrants | Moldova | 43.1 /100 | #179 | Average 3.0% |
| Immigrants | Sweden | 42.4 /100 | #180 | Average 3.0% |
| Immigrants | Belgium | 41.5 /100 | #181 | Average 3.0% |
| Immigrants | Italy | 41.1 /100 | #182 | Average 3.0% |
| Bulgarians | 39.7 /100 | #183 | Fair 3.0% |
| Immigrants | Ireland | 37.4 /100 | #184 | Fair 3.0% |