Cheyenne vs Immigrants from Uganda 2nd Grade
COMPARE
Cheyenne
Immigrants from Uganda
2nd Grade
2nd Grade Comparison
Cheyenne
Immigrants from Uganda
98.3%
2ND GRADE
99.6/ 100
METRIC RATING
72nd/ 347
METRIC RANK
97.8%
2ND GRADE
26.3/ 100
METRIC RATING
197th/ 347
METRIC RANK
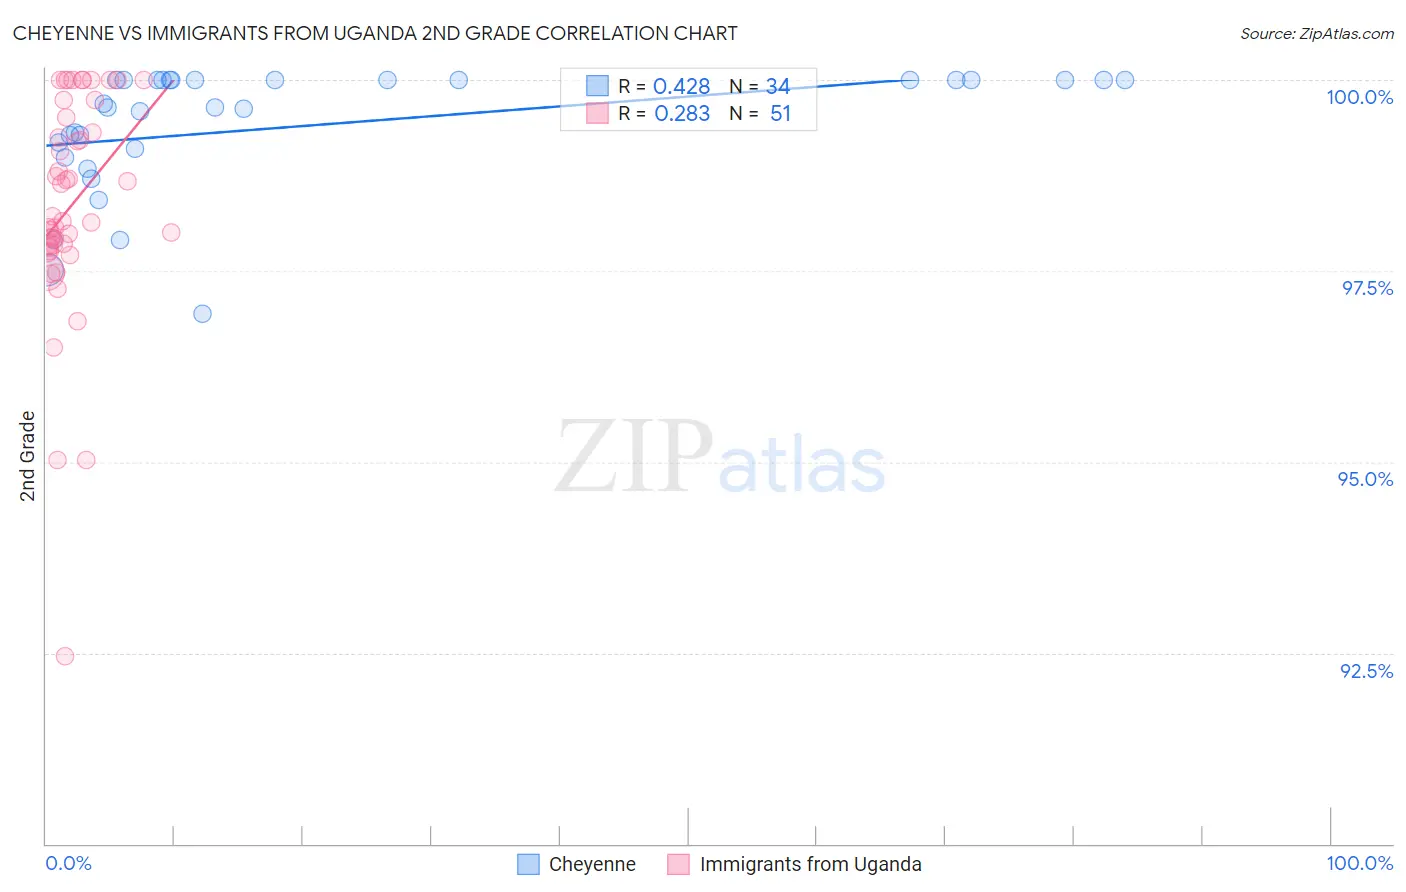
Cheyenne vs Immigrants from Uganda 2nd Grade Correlation Chart
The statistical analysis conducted on geographies consisting of 80,719,411 people shows a moderate positive correlation between the proportion of Cheyenne and percentage of population with at least 2nd grade education in the United States with a correlation coefficient (R) of 0.428 and weighted average of 98.3%. Similarly, the statistical analysis conducted on geographies consisting of 125,908,537 people shows a weak positive correlation between the proportion of Immigrants from Uganda and percentage of population with at least 2nd grade education in the United States with a correlation coefficient (R) of 0.283 and weighted average of 97.8%, a difference of 0.51%.
2nd Grade Correlation Summary
| Measurement | Cheyenne | Immigrants from Uganda |
| Minimum | 96.9% | 92.5% |
| Maximum | 100.0% | 100.0% |
| Range | 3.1% | 7.5% |
| Mean | 99.4% | 98.3% |
| Median | 99.7% | 98.2% |
| Interquartile 25% (IQ1) | 99.1% | 97.8% |
| Interquartile 75% (IQ3) | 100.0% | 99.5% |
| Interquartile Range (IQR) | 0.90% | 1.7% |
| Standard Deviation (Sample) | 0.82% | 1.5% |
| Standard Deviation (Population) | 0.81% | 1.4% |
Similar Demographics by 2nd Grade
Demographics Similar to Cheyenne by 2nd Grade
In terms of 2nd grade, the demographic groups most similar to Cheyenne are Cajun (98.3%, a difference of 0.0%), Chickasaw (98.3%, a difference of 0.010%), Canadian (98.3%, a difference of 0.020%), Immigrants from Northern Europe (98.3%, a difference of 0.020%), and Russian (98.3%, a difference of 0.020%).
| Demographics | Rating | Rank | 2nd Grade |
| New Zealanders | 99.7 /100 | #65 | Exceptional 98.3% |
| Canadians | 99.7 /100 | #66 | Exceptional 98.3% |
| Immigrants | Northern Europe | 99.7 /100 | #67 | Exceptional 98.3% |
| Russians | 99.7 /100 | #68 | Exceptional 98.3% |
| Immigrants | Austria | 99.6 /100 | #69 | Exceptional 98.3% |
| Serbians | 99.6 /100 | #70 | Exceptional 98.3% |
| Chickasaw | 99.6 /100 | #71 | Exceptional 98.3% |
| Cheyenne | 99.6 /100 | #72 | Exceptional 98.3% |
| Cajuns | 99.5 /100 | #73 | Exceptional 98.3% |
| Immigrants | Netherlands | 99.4 /100 | #74 | Exceptional 98.3% |
| Shoshone | 99.4 /100 | #75 | Exceptional 98.3% |
| Cherokee | 99.4 /100 | #76 | Exceptional 98.3% |
| Immigrants | England | 99.4 /100 | #77 | Exceptional 98.3% |
| Immigrants | Lithuania | 99.3 /100 | #78 | Exceptional 98.2% |
| Immigrants | Belgium | 99.3 /100 | #79 | Exceptional 98.2% |
Demographics Similar to Immigrants from Uganda by 2nd Grade
In terms of 2nd grade, the demographic groups most similar to Immigrants from Uganda are Paiute (97.8%, a difference of 0.0%), Mongolian (97.8%, a difference of 0.0%), Immigrants from Kenya (97.8%, a difference of 0.0%), Guamanian/Chamorro (97.8%, a difference of 0.0%), and Black/African American (97.8%, a difference of 0.010%).
| Demographics | Rating | Rank | 2nd Grade |
| Immigrants | Taiwan | 31.8 /100 | #190 | Fair 97.8% |
| Paraguayans | 30.8 /100 | #191 | Fair 97.8% |
| Blacks/African Americans | 29.9 /100 | #192 | Fair 97.8% |
| Hawaiians | 28.5 /100 | #193 | Fair 97.8% |
| Paiute | 27.0 /100 | #194 | Fair 97.8% |
| Mongolians | 26.7 /100 | #195 | Fair 97.8% |
| Immigrants | Kenya | 26.4 /100 | #196 | Fair 97.8% |
| Immigrants | Uganda | 26.3 /100 | #197 | Fair 97.8% |
| Guamanians/Chamorros | 25.7 /100 | #198 | Fair 97.8% |
| Immigrants | Egypt | 24.4 /100 | #199 | Fair 97.8% |
| Immigrants | Lebanon | 20.9 /100 | #200 | Fair 97.8% |
| Tohono O'odham | 20.9 /100 | #201 | Fair 97.8% |
| Immigrants | Ukraine | 20.5 /100 | #202 | Fair 97.8% |
| Yuman | 20.0 /100 | #203 | Fair 97.8% |
| Immigrants | Albania | 18.4 /100 | #204 | Poor 97.8% |