Cheyenne vs Immigrants from Somalia Hearing Disability
COMPARE
Cheyenne
Immigrants from Somalia
Hearing Disability
Hearing Disability Comparison
Cheyenne
Immigrants from Somalia
4.0%
HEARING DISABILITY
0.0/ 100
METRIC RATING
318th/ 347
METRIC RANK
2.8%
HEARING DISABILITY
95.5/ 100
METRIC RATING
96th/ 347
METRIC RANK
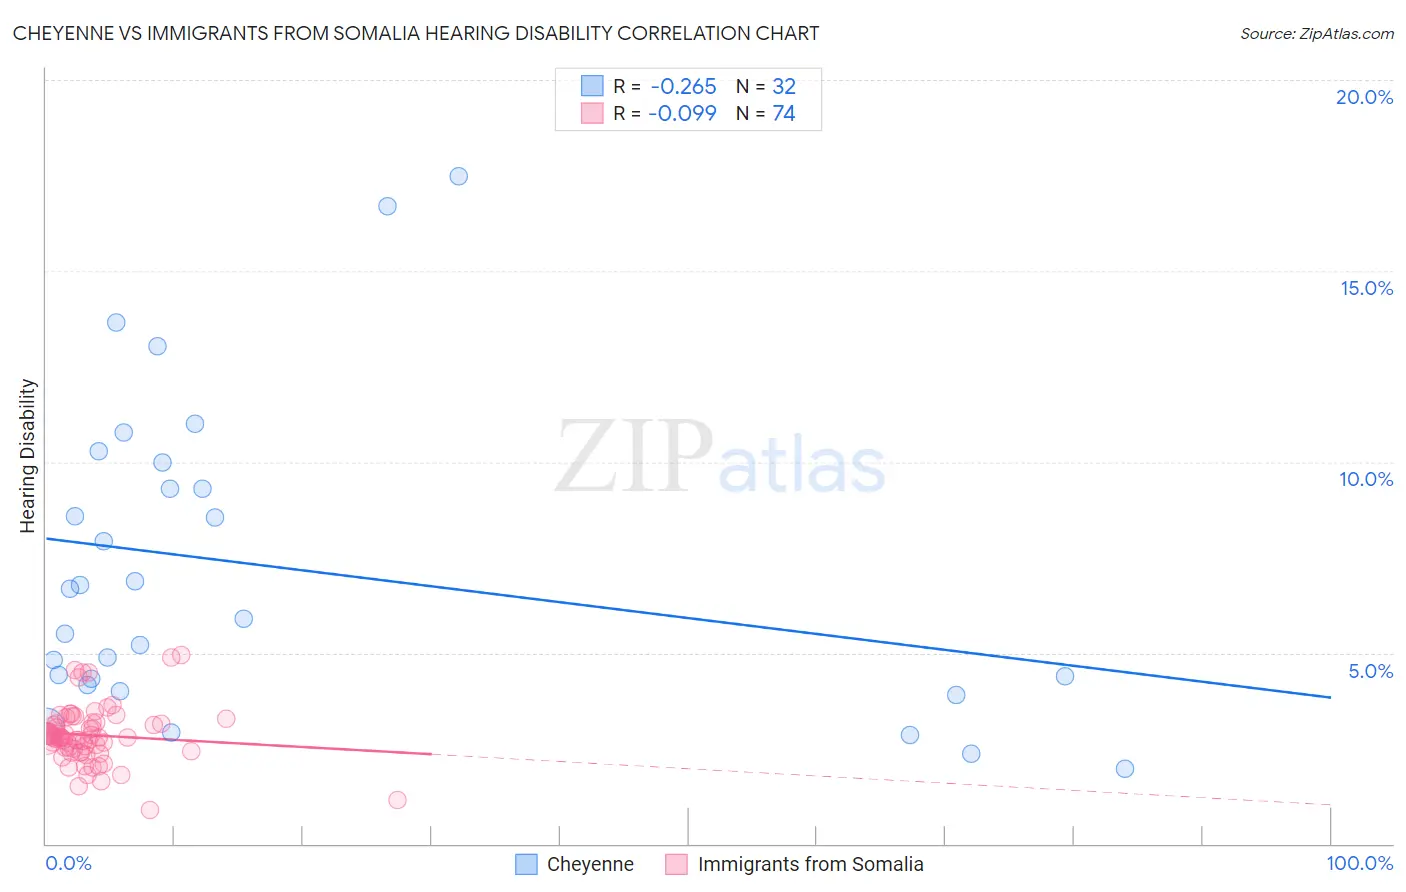
Cheyenne vs Immigrants from Somalia Hearing Disability Correlation Chart
The statistical analysis conducted on geographies consisting of 80,707,533 people shows a weak negative correlation between the proportion of Cheyenne and percentage of population with hearing disability in the United States with a correlation coefficient (R) of -0.265 and weighted average of 4.0%. Similarly, the statistical analysis conducted on geographies consisting of 92,097,804 people shows a slight negative correlation between the proportion of Immigrants from Somalia and percentage of population with hearing disability in the United States with a correlation coefficient (R) of -0.099 and weighted average of 2.8%, a difference of 42.8%.
Hearing Disability Correlation Summary
| Measurement | Cheyenne | Immigrants from Somalia |
| Minimum | 2.0% | 0.87% |
| Maximum | 17.5% | 5.0% |
| Range | 15.5% | 4.1% |
| Mean | 7.2% | 2.8% |
| Median | 6.3% | 2.8% |
| Interquartile 25% (IQ1) | 4.2% | 2.5% |
| Interquartile 75% (IQ3) | 9.6% | 3.2% |
| Interquartile Range (IQR) | 5.4% | 0.69% |
| Standard Deviation (Sample) | 4.0% | 0.75% |
| Standard Deviation (Population) | 4.0% | 0.75% |
Similar Demographics by Hearing Disability
Demographics Similar to Cheyenne by Hearing Disability
In terms of hearing disability, the demographic groups most similar to Cheyenne are Comanche (4.0%, a difference of 0.17%), Spanish American (4.0%, a difference of 0.31%), Puget Sound Salish (3.9%, a difference of 0.51%), Yakama (3.9%, a difference of 0.52%), and Chippewa (4.0%, a difference of 0.65%).
| Demographics | Rating | Rank | Hearing Disability |
| Americans | 0.0 /100 | #311 | Tragic 3.9% |
| Cajuns | 0.0 /100 | #312 | Tragic 3.9% |
| Hopi | 0.0 /100 | #313 | Tragic 3.9% |
| Yakama | 0.0 /100 | #314 | Tragic 3.9% |
| Puget Sound Salish | 0.0 /100 | #315 | Tragic 3.9% |
| Spanish Americans | 0.0 /100 | #316 | Tragic 4.0% |
| Comanche | 0.0 /100 | #317 | Tragic 4.0% |
| Cheyenne | 0.0 /100 | #318 | Tragic 4.0% |
| Chippewa | 0.0 /100 | #319 | Tragic 4.0% |
| Shoshone | 0.0 /100 | #320 | Tragic 4.0% |
| Paiute | 0.0 /100 | #321 | Tragic 4.1% |
| Seminole | 0.0 /100 | #322 | Tragic 4.1% |
| Apache | 0.0 /100 | #323 | Tragic 4.1% |
| Osage | 0.0 /100 | #324 | Tragic 4.1% |
| Lumbee | 0.0 /100 | #325 | Tragic 4.1% |
Demographics Similar to Immigrants from Somalia by Hearing Disability
In terms of hearing disability, the demographic groups most similar to Immigrants from Somalia are Immigrants from Afghanistan (2.8%, a difference of 0.17%), Israeli (2.8%, a difference of 0.19%), Uruguayan (2.8%, a difference of 0.21%), Immigrants from Honduras (2.8%, a difference of 0.23%), and Immigrants from Guatemala (2.8%, a difference of 0.27%).
| Demographics | Rating | Rank | Hearing Disability |
| Belizeans | 96.6 /100 | #89 | Exceptional 2.8% |
| Immigrants | Morocco | 96.6 /100 | #90 | Exceptional 2.8% |
| Immigrants | Middle Africa | 96.5 /100 | #91 | Exceptional 2.8% |
| Iranians | 96.4 /100 | #92 | Exceptional 2.8% |
| Immigrants | Kuwait | 96.3 /100 | #93 | Exceptional 2.8% |
| Uruguayans | 95.9 /100 | #94 | Exceptional 2.8% |
| Israelis | 95.9 /100 | #95 | Exceptional 2.8% |
| Immigrants | Somalia | 95.5 /100 | #96 | Exceptional 2.8% |
| Immigrants | Afghanistan | 95.3 /100 | #97 | Exceptional 2.8% |
| Immigrants | Honduras | 95.1 /100 | #98 | Exceptional 2.8% |
| Immigrants | Guatemala | 95.1 /100 | #99 | Exceptional 2.8% |
| Immigrants | Eastern Africa | 95.0 /100 | #100 | Exceptional 2.8% |
| Immigrants | Spain | 94.9 /100 | #101 | Exceptional 2.8% |
| Taiwanese | 94.8 /100 | #102 | Exceptional 2.8% |
| Immigrants | Indonesia | 94.7 /100 | #103 | Exceptional 2.8% |