Cheyenne vs Immigrants from Iraq Hearing Disability
COMPARE
Cheyenne
Immigrants from Iraq
Hearing Disability
Hearing Disability Comparison
Cheyenne
Immigrants from Iraq
4.0%
HEARING DISABILITY
0.0/ 100
METRIC RATING
318th/ 347
METRIC RANK
3.1%
HEARING DISABILITY
10.5/ 100
METRIC RATING
213th/ 347
METRIC RANK
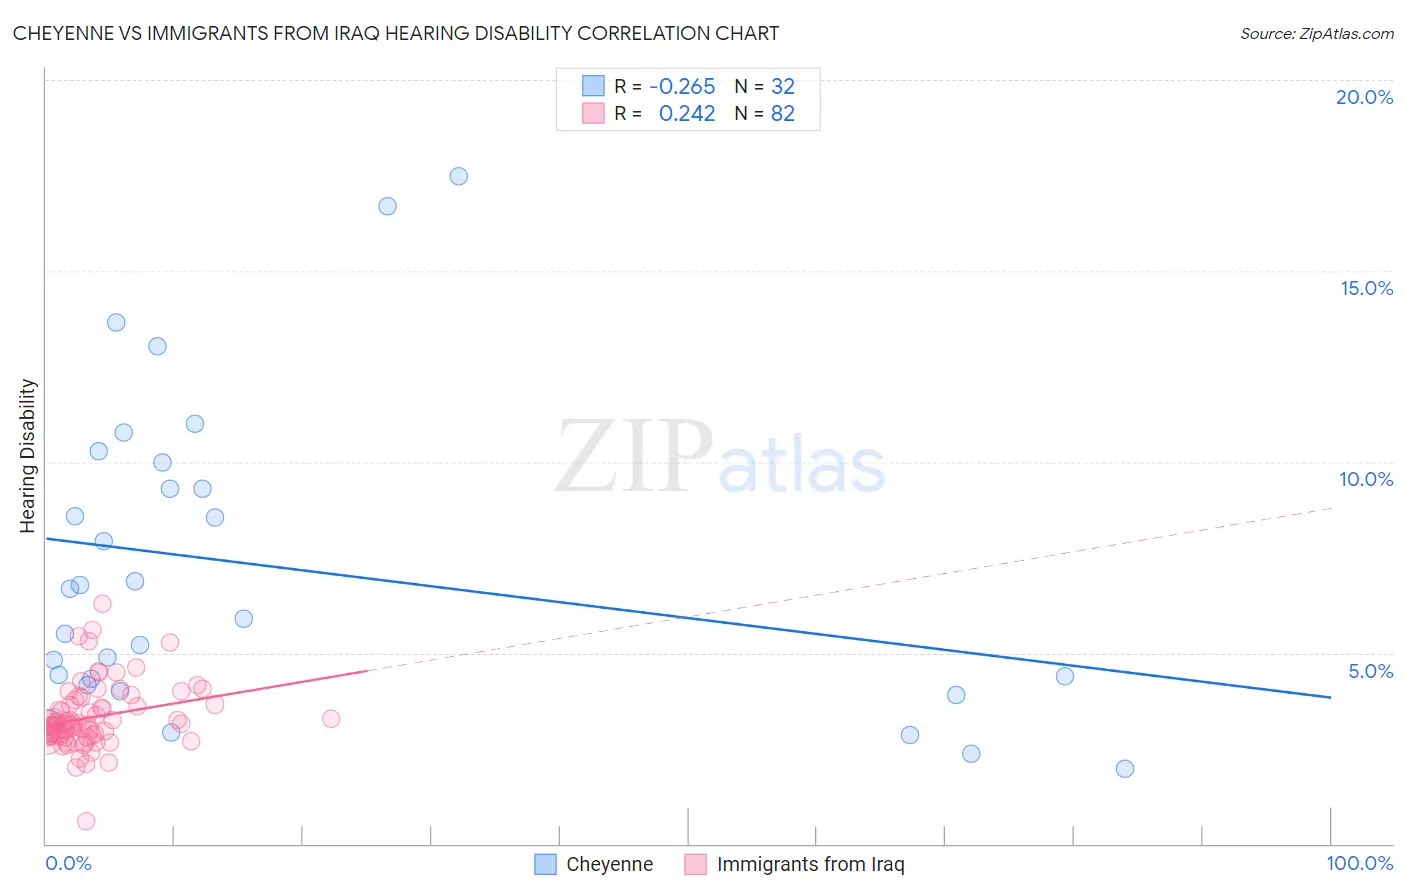
Cheyenne vs Immigrants from Iraq Hearing Disability Correlation Chart
The statistical analysis conducted on geographies consisting of 80,707,533 people shows a weak negative correlation between the proportion of Cheyenne and percentage of population with hearing disability in the United States with a correlation coefficient (R) of -0.265 and weighted average of 4.0%. Similarly, the statistical analysis conducted on geographies consisting of 194,749,544 people shows a weak positive correlation between the proportion of Immigrants from Iraq and percentage of population with hearing disability in the United States with a correlation coefficient (R) of 0.242 and weighted average of 3.1%, a difference of 26.1%.
Hearing Disability Correlation Summary
| Measurement | Cheyenne | Immigrants from Iraq |
| Minimum | 2.0% | 0.59% |
| Maximum | 17.5% | 6.3% |
| Range | 15.5% | 5.7% |
| Mean | 7.2% | 3.3% |
| Median | 6.3% | 3.1% |
| Interquartile 25% (IQ1) | 4.2% | 2.8% |
| Interquartile 75% (IQ3) | 9.6% | 3.6% |
| Interquartile Range (IQR) | 5.4% | 0.81% |
| Standard Deviation (Sample) | 4.0% | 0.86% |
| Standard Deviation (Population) | 4.0% | 0.86% |
Similar Demographics by Hearing Disability
Demographics Similar to Cheyenne by Hearing Disability
In terms of hearing disability, the demographic groups most similar to Cheyenne are Comanche (4.0%, a difference of 0.17%), Spanish American (4.0%, a difference of 0.31%), Puget Sound Salish (3.9%, a difference of 0.51%), Yakama (3.9%, a difference of 0.52%), and Chippewa (4.0%, a difference of 0.65%).
| Demographics | Rating | Rank | Hearing Disability |
| Americans | 0.0 /100 | #311 | Tragic 3.9% |
| Cajuns | 0.0 /100 | #312 | Tragic 3.9% |
| Hopi | 0.0 /100 | #313 | Tragic 3.9% |
| Yakama | 0.0 /100 | #314 | Tragic 3.9% |
| Puget Sound Salish | 0.0 /100 | #315 | Tragic 3.9% |
| Spanish Americans | 0.0 /100 | #316 | Tragic 4.0% |
| Comanche | 0.0 /100 | #317 | Tragic 4.0% |
| Cheyenne | 0.0 /100 | #318 | Tragic 4.0% |
| Chippewa | 0.0 /100 | #319 | Tragic 4.0% |
| Shoshone | 0.0 /100 | #320 | Tragic 4.0% |
| Paiute | 0.0 /100 | #321 | Tragic 4.1% |
| Seminole | 0.0 /100 | #322 | Tragic 4.1% |
| Apache | 0.0 /100 | #323 | Tragic 4.1% |
| Osage | 0.0 /100 | #324 | Tragic 4.1% |
| Lumbee | 0.0 /100 | #325 | Tragic 4.1% |
Demographics Similar to Immigrants from Iraq by Hearing Disability
In terms of hearing disability, the demographic groups most similar to Immigrants from Iraq are Pakistani (3.1%, a difference of 0.15%), Romanian (3.1%, a difference of 0.36%), Cape Verdean (3.1%, a difference of 0.39%), Immigrants from Hungary (3.1%, a difference of 0.44%), and Immigrants from Latvia (3.1%, a difference of 0.48%).
| Demographics | Rating | Rank | Hearing Disability |
| Eastern Europeans | 15.5 /100 | #206 | Poor 3.1% |
| Hispanics or Latinos | 15.1 /100 | #207 | Poor 3.1% |
| Immigrants | Latvia | 12.7 /100 | #208 | Poor 3.1% |
| Immigrants | Hungary | 12.5 /100 | #209 | Poor 3.1% |
| Cape Verdeans | 12.2 /100 | #210 | Poor 3.1% |
| Romanians | 12.1 /100 | #211 | Poor 3.1% |
| Pakistanis | 11.1 /100 | #212 | Poor 3.1% |
| Immigrants | Iraq | 10.5 /100 | #213 | Poor 3.1% |
| Australians | 8.1 /100 | #214 | Tragic 3.2% |
| Bangladeshis | 8.1 /100 | #215 | Tragic 3.2% |
| Immigrants | Norway | 7.3 /100 | #216 | Tragic 3.2% |
| Russians | 7.1 /100 | #217 | Tragic 3.2% |
| Immigrants | Northern Europe | 7.0 /100 | #218 | Tragic 3.2% |
| New Zealanders | 6.8 /100 | #219 | Tragic 3.2% |
| Malaysians | 6.6 /100 | #220 | Tragic 3.2% |