Central American vs Immigrants from Burma/Myanmar Disability Age 65 to 74
COMPARE
Central American
Immigrants from Burma/Myanmar
Disability Age 65 to 74
Disability Age 65 to 74 Comparison
Central Americans
Immigrants from Burma/Myanmar
25.1%
DISABILITY AGE 65 TO 74
0.5/ 100
METRIC RATING
255th/ 347
METRIC RANK
24.0%
DISABILITY AGE 65 TO 74
11.6/ 100
METRIC RATING
219th/ 347
METRIC RANK
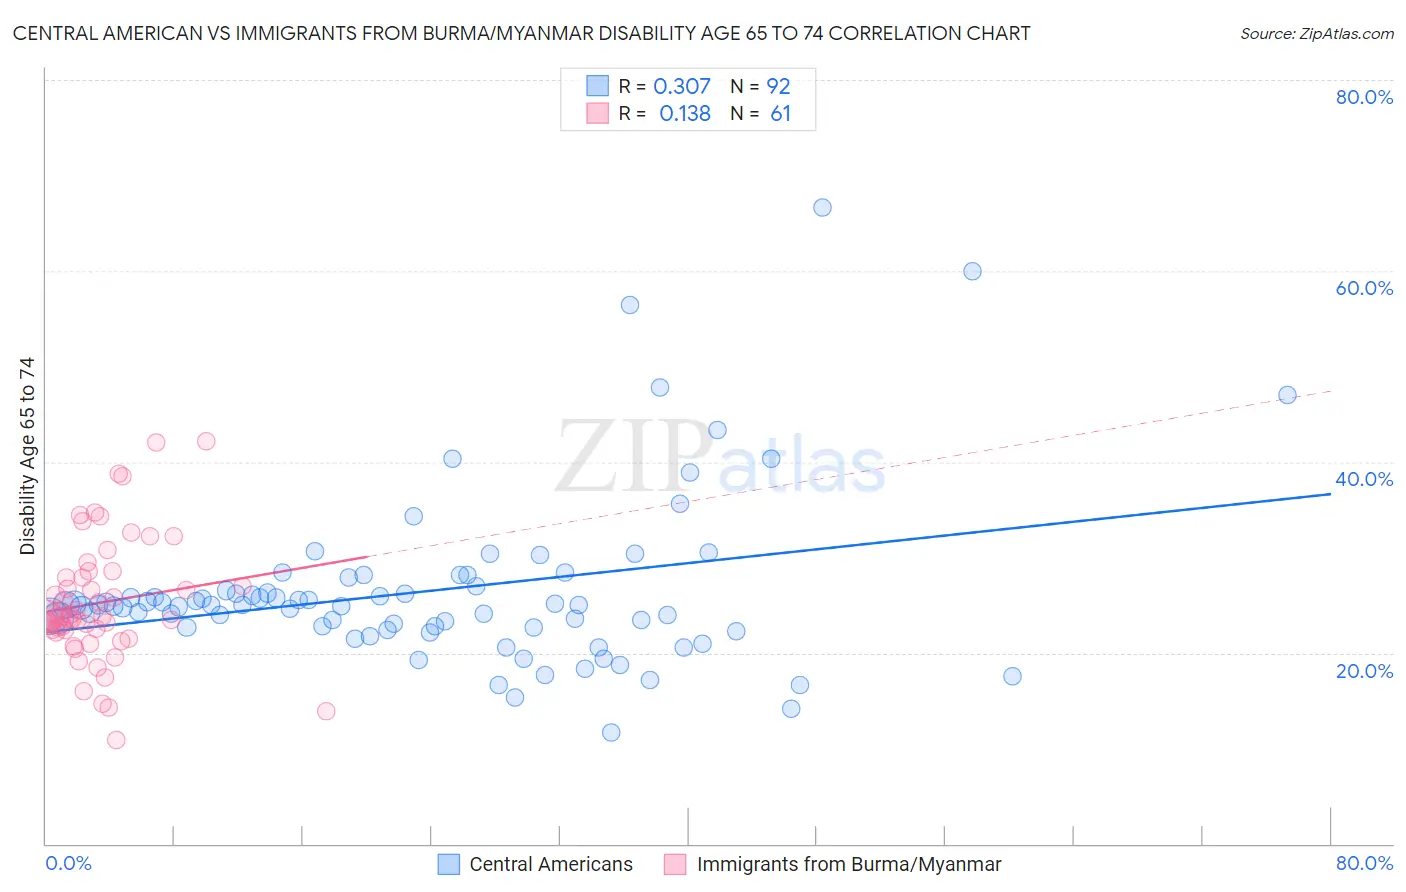
Central American vs Immigrants from Burma/Myanmar Disability Age 65 to 74 Correlation Chart
The statistical analysis conducted on geographies consisting of 503,060,028 people shows a mild positive correlation between the proportion of Central Americans and percentage of population with a disability between the ages 65 and 75 in the United States with a correlation coefficient (R) of 0.307 and weighted average of 25.1%. Similarly, the statistical analysis conducted on geographies consisting of 172,172,101 people shows a poor positive correlation between the proportion of Immigrants from Burma/Myanmar and percentage of population with a disability between the ages 65 and 75 in the United States with a correlation coefficient (R) of 0.138 and weighted average of 24.0%, a difference of 4.6%.
Disability Age 65 to 74 Correlation Summary
| Measurement | Central American | Immigrants from Burma/Myanmar |
| Minimum | 11.6% | 10.8% |
| Maximum | 66.7% | 42.1% |
| Range | 55.1% | 31.3% |
| Mean | 26.5% | 25.3% |
| Median | 25.0% | 23.9% |
| Interquartile 25% (IQ1) | 22.7% | 22.3% |
| Interquartile 75% (IQ3) | 26.8% | 28.3% |
| Interquartile Range (IQR) | 4.1% | 6.0% |
| Standard Deviation (Sample) | 8.9% | 6.5% |
| Standard Deviation (Population) | 8.9% | 6.4% |
Similar Demographics by Disability Age 65 to 74
Demographics Similar to Central Americans by Disability Age 65 to 74
In terms of disability age 65 to 74, the demographic groups most similar to Central Americans are Somali (25.1%, a difference of 0.16%), Subsaharan African (25.1%, a difference of 0.23%), Immigrants from El Salvador (25.1%, a difference of 0.27%), Immigrants from Somalia (25.2%, a difference of 0.41%), and Nonimmigrants (25.0%, a difference of 0.46%).
| Demographics | Rating | Rank | Disability Age 65 to 74 |
| Senegalese | 0.9 /100 | #248 | Tragic 24.9% |
| Immigrants | Fiji | 0.8 /100 | #249 | Tragic 25.0% |
| Salvadorans | 0.8 /100 | #250 | Tragic 25.0% |
| Immigrants | Nonimmigrants | 0.7 /100 | #251 | Tragic 25.0% |
| Immigrants | El Salvador | 0.6 /100 | #252 | Tragic 25.1% |
| Sub-Saharan Africans | 0.6 /100 | #253 | Tragic 25.1% |
| Somalis | 0.6 /100 | #254 | Tragic 25.1% |
| Central Americans | 0.5 /100 | #255 | Tragic 25.1% |
| Immigrants | Somalia | 0.4 /100 | #256 | Tragic 25.2% |
| Guamanians/Chamorros | 0.3 /100 | #257 | Tragic 25.3% |
| Marshallese | 0.3 /100 | #258 | Tragic 25.3% |
| Immigrants | Cambodia | 0.3 /100 | #259 | Tragic 25.3% |
| Malaysians | 0.2 /100 | #260 | Tragic 25.4% |
| Cape Verdeans | 0.2 /100 | #261 | Tragic 25.4% |
| Samoans | 0.2 /100 | #262 | Tragic 25.4% |
Demographics Similar to Immigrants from Burma/Myanmar by Disability Age 65 to 74
In terms of disability age 65 to 74, the demographic groups most similar to Immigrants from Burma/Myanmar are Immigrants from Portugal (24.0%, a difference of 0.020%), Immigrants from Nigeria (24.0%, a difference of 0.020%), Jamaican (24.0%, a difference of 0.090%), Ghanaian (24.1%, a difference of 0.18%), and Pennsylvania German (24.0%, a difference of 0.22%).
| Demographics | Rating | Rank | Disability Age 65 to 74 |
| French | 15.7 /100 | #212 | Poor 23.9% |
| Nicaraguans | 14.3 /100 | #213 | Poor 23.9% |
| Immigrants | Oceania | 13.6 /100 | #214 | Poor 24.0% |
| Pennsylvania Germans | 13.3 /100 | #215 | Poor 24.0% |
| Jamaicans | 12.2 /100 | #216 | Poor 24.0% |
| Immigrants | Portugal | 11.7 /100 | #217 | Poor 24.0% |
| Immigrants | Nigeria | 11.7 /100 | #218 | Poor 24.0% |
| Immigrants | Burma/Myanmar | 11.6 /100 | #219 | Poor 24.0% |
| Ghanaians | 10.4 /100 | #220 | Poor 24.1% |
| Immigrants | Nicaragua | 9.8 /100 | #221 | Tragic 24.1% |
| Native Hawaiians | 9.3 /100 | #222 | Tragic 24.1% |
| Immigrants | Middle Africa | 8.9 /100 | #223 | Tragic 24.1% |
| Immigrants | Panama | 8.6 /100 | #224 | Tragic 24.1% |
| Bermudans | 8.2 /100 | #225 | Tragic 24.2% |
| Iraqis | 8.1 /100 | #226 | Tragic 24.2% |