Asian vs Immigrants from Burma/Myanmar Disability Age 65 to 74
COMPARE
Asian
Immigrants from Burma/Myanmar
Disability Age 65 to 74
Disability Age 65 to 74 Comparison
Asians
Immigrants from Burma/Myanmar
21.4%
DISABILITY AGE 65 TO 74
99.7/ 100
METRIC RATING
45th/ 347
METRIC RANK
24.0%
DISABILITY AGE 65 TO 74
11.6/ 100
METRIC RATING
219th/ 347
METRIC RANK
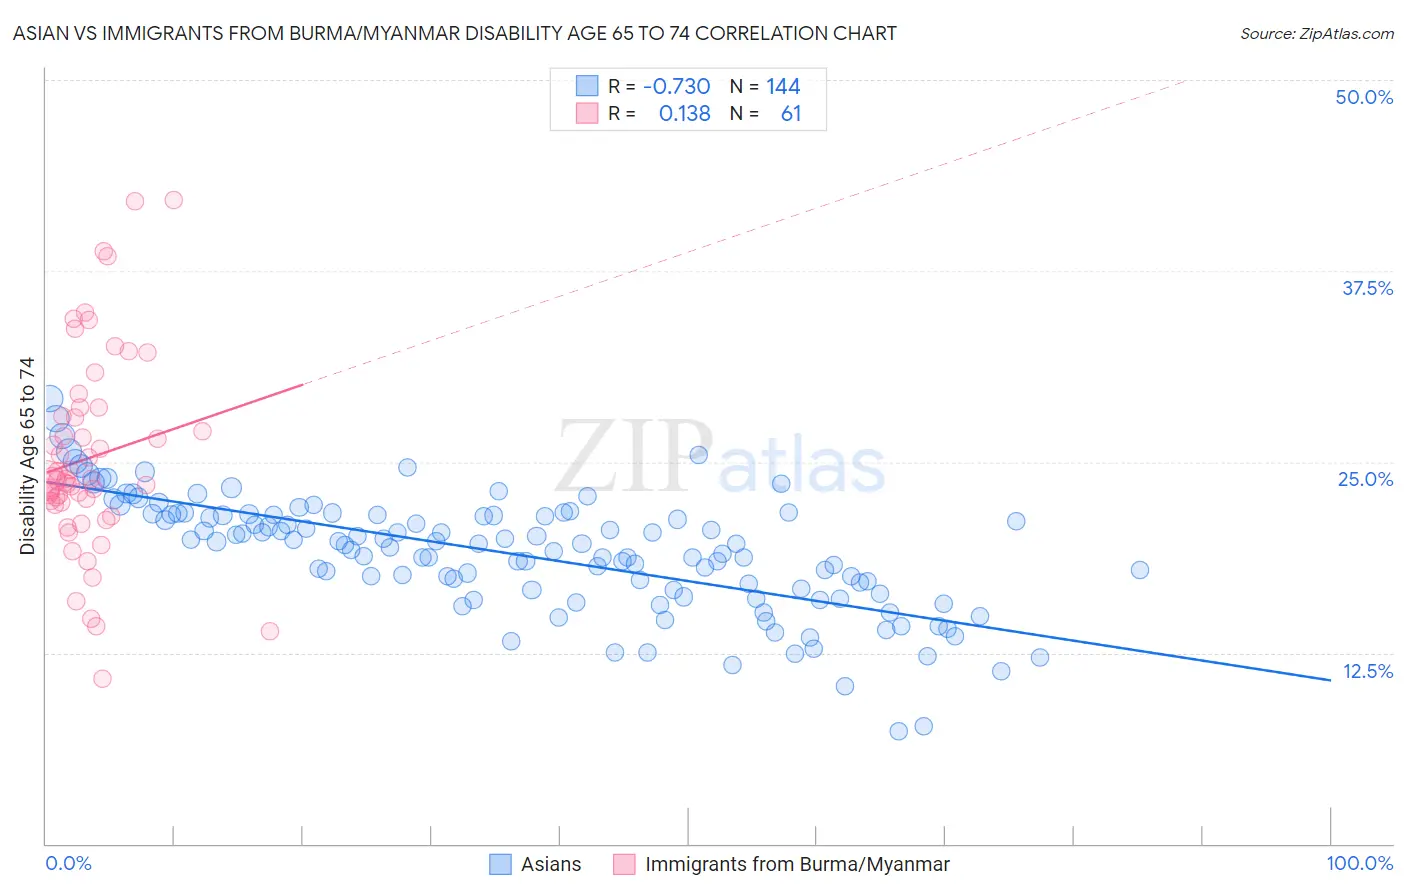
Asian vs Immigrants from Burma/Myanmar Disability Age 65 to 74 Correlation Chart
The statistical analysis conducted on geographies consisting of 548,760,031 people shows a strong negative correlation between the proportion of Asians and percentage of population with a disability between the ages 65 and 75 in the United States with a correlation coefficient (R) of -0.730 and weighted average of 21.4%. Similarly, the statistical analysis conducted on geographies consisting of 172,172,101 people shows a poor positive correlation between the proportion of Immigrants from Burma/Myanmar and percentage of population with a disability between the ages 65 and 75 in the United States with a correlation coefficient (R) of 0.138 and weighted average of 24.0%, a difference of 12.4%.
Disability Age 65 to 74 Correlation Summary
| Measurement | Asian | Immigrants from Burma/Myanmar |
| Minimum | 7.3% | 10.8% |
| Maximum | 29.1% | 42.1% |
| Range | 21.8% | 31.3% |
| Mean | 19.0% | 25.3% |
| Median | 19.6% | 23.9% |
| Interquartile 25% (IQ1) | 16.6% | 22.3% |
| Interquartile 75% (IQ3) | 21.5% | 28.3% |
| Interquartile Range (IQR) | 4.9% | 6.0% |
| Standard Deviation (Sample) | 3.8% | 6.5% |
| Standard Deviation (Population) | 3.8% | 6.4% |
Similar Demographics by Disability Age 65 to 74
Demographics Similar to Asians by Disability Age 65 to 74
In terms of disability age 65 to 74, the demographic groups most similar to Asians are Estonian (21.4%, a difference of 0.020%), Immigrants from Turkey (21.4%, a difference of 0.030%), Immigrants from Bulgaria (21.4%, a difference of 0.030%), Lithuanian (21.4%, a difference of 0.080%), and Luxembourger (21.4%, a difference of 0.080%).
| Demographics | Rating | Rank | Disability Age 65 to 74 |
| Russians | 99.8 /100 | #38 | Exceptional 21.2% |
| Argentineans | 99.8 /100 | #39 | Exceptional 21.2% |
| Latvians | 99.8 /100 | #40 | Exceptional 21.2% |
| Immigrants | Austria | 99.8 /100 | #41 | Exceptional 21.2% |
| Macedonians | 99.7 /100 | #42 | Exceptional 21.3% |
| Immigrants | Croatia | 99.7 /100 | #43 | Exceptional 21.3% |
| Estonians | 99.7 /100 | #44 | Exceptional 21.4% |
| Asians | 99.7 /100 | #45 | Exceptional 21.4% |
| Immigrants | Turkey | 99.7 /100 | #46 | Exceptional 21.4% |
| Immigrants | Bulgaria | 99.7 /100 | #47 | Exceptional 21.4% |
| Lithuanians | 99.7 /100 | #48 | Exceptional 21.4% |
| Luxembourgers | 99.7 /100 | #49 | Exceptional 21.4% |
| Immigrants | Malaysia | 99.7 /100 | #50 | Exceptional 21.4% |
| Immigrants | Serbia | 99.6 /100 | #51 | Exceptional 21.4% |
| Immigrants | France | 99.6 /100 | #52 | Exceptional 21.5% |
Demographics Similar to Immigrants from Burma/Myanmar by Disability Age 65 to 74
In terms of disability age 65 to 74, the demographic groups most similar to Immigrants from Burma/Myanmar are Immigrants from Portugal (24.0%, a difference of 0.020%), Immigrants from Nigeria (24.0%, a difference of 0.020%), Jamaican (24.0%, a difference of 0.090%), Ghanaian (24.1%, a difference of 0.18%), and Pennsylvania German (24.0%, a difference of 0.22%).
| Demographics | Rating | Rank | Disability Age 65 to 74 |
| French | 15.7 /100 | #212 | Poor 23.9% |
| Nicaraguans | 14.3 /100 | #213 | Poor 23.9% |
| Immigrants | Oceania | 13.6 /100 | #214 | Poor 24.0% |
| Pennsylvania Germans | 13.3 /100 | #215 | Poor 24.0% |
| Jamaicans | 12.2 /100 | #216 | Poor 24.0% |
| Immigrants | Portugal | 11.7 /100 | #217 | Poor 24.0% |
| Immigrants | Nigeria | 11.7 /100 | #218 | Poor 24.0% |
| Immigrants | Burma/Myanmar | 11.6 /100 | #219 | Poor 24.0% |
| Ghanaians | 10.4 /100 | #220 | Poor 24.1% |
| Immigrants | Nicaragua | 9.8 /100 | #221 | Tragic 24.1% |
| Native Hawaiians | 9.3 /100 | #222 | Tragic 24.1% |
| Immigrants | Middle Africa | 8.9 /100 | #223 | Tragic 24.1% |
| Immigrants | Panama | 8.6 /100 | #224 | Tragic 24.1% |
| Bermudans | 8.2 /100 | #225 | Tragic 24.2% |
| Iraqis | 8.1 /100 | #226 | Tragic 24.2% |