Immigrants from Philippines vs Immigrants from Burma/Myanmar Disability Age 65 to 74
COMPARE
Immigrants from Philippines
Immigrants from Burma/Myanmar
Disability Age 65 to 74
Disability Age 65 to 74 Comparison
Immigrants from Philippines
Immigrants from Burma/Myanmar
23.2%
DISABILITY AGE 65 TO 74
61.1/ 100
METRIC RATING
163rd/ 347
METRIC RANK
24.0%
DISABILITY AGE 65 TO 74
11.6/ 100
METRIC RATING
219th/ 347
METRIC RANK
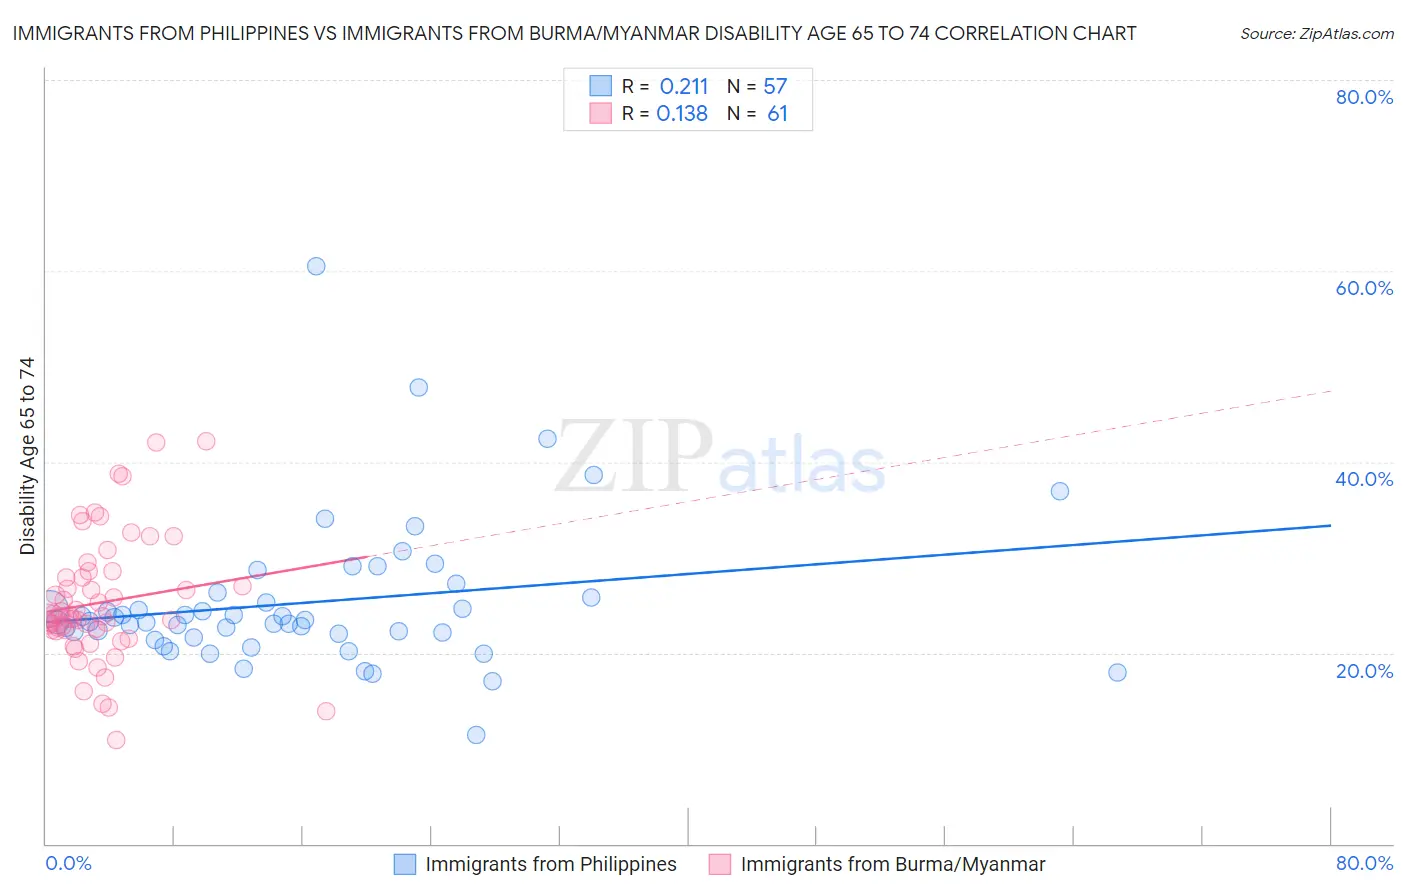
Immigrants from Philippines vs Immigrants from Burma/Myanmar Disability Age 65 to 74 Correlation Chart
The statistical analysis conducted on geographies consisting of 470,156,643 people shows a weak positive correlation between the proportion of Immigrants from Philippines and percentage of population with a disability between the ages 65 and 75 in the United States with a correlation coefficient (R) of 0.211 and weighted average of 23.2%. Similarly, the statistical analysis conducted on geographies consisting of 172,172,101 people shows a poor positive correlation between the proportion of Immigrants from Burma/Myanmar and percentage of population with a disability between the ages 65 and 75 in the United States with a correlation coefficient (R) of 0.138 and weighted average of 24.0%, a difference of 3.6%.
Disability Age 65 to 74 Correlation Summary
| Measurement | Immigrants from Philippines | Immigrants from Burma/Myanmar |
| Minimum | 11.4% | 10.8% |
| Maximum | 60.5% | 42.1% |
| Range | 49.1% | 31.3% |
| Mean | 25.3% | 25.3% |
| Median | 23.3% | 23.9% |
| Interquartile 25% (IQ1) | 21.8% | 22.3% |
| Interquartile 75% (IQ3) | 26.1% | 28.3% |
| Interquartile Range (IQR) | 4.3% | 6.0% |
| Standard Deviation (Sample) | 7.7% | 6.5% |
| Standard Deviation (Population) | 7.7% | 6.4% |
Similar Demographics by Disability Age 65 to 74
Demographics Similar to Immigrants from Philippines by Disability Age 65 to 74
In terms of disability age 65 to 74, the demographic groups most similar to Immigrants from Philippines are European (23.2%, a difference of 0.0%), Sierra Leonean (23.2%, a difference of 0.010%), Vietnamese (23.2%, a difference of 0.020%), Immigrants from Afghanistan (23.2%, a difference of 0.040%), and Immigrants from Cameroon (23.1%, a difference of 0.16%).
| Demographics | Rating | Rank | Disability Age 65 to 74 |
| Immigrants | Western Asia | 73.8 /100 | #156 | Good 23.0% |
| Czechoslovakians | 72.4 /100 | #157 | Good 23.0% |
| Immigrants | Vietnam | 69.1 /100 | #158 | Good 23.1% |
| South American Indians | 65.5 /100 | #159 | Good 23.1% |
| Koreans | 64.2 /100 | #160 | Good 23.1% |
| Immigrants | Cameroon | 63.8 /100 | #161 | Good 23.1% |
| Europeans | 61.2 /100 | #162 | Good 23.2% |
| Immigrants | Philippines | 61.1 /100 | #163 | Good 23.2% |
| Sierra Leoneans | 60.9 /100 | #164 | Good 23.2% |
| Vietnamese | 60.8 /100 | #165 | Good 23.2% |
| Immigrants | Afghanistan | 60.5 /100 | #166 | Good 23.2% |
| Immigrants | Bosnia and Herzegovina | 57.6 /100 | #167 | Average 23.2% |
| Pakistanis | 57.0 /100 | #168 | Average 23.2% |
| Icelanders | 54.3 /100 | #169 | Average 23.3% |
| Moroccans | 54.2 /100 | #170 | Average 23.3% |
Demographics Similar to Immigrants from Burma/Myanmar by Disability Age 65 to 74
In terms of disability age 65 to 74, the demographic groups most similar to Immigrants from Burma/Myanmar are Immigrants from Portugal (24.0%, a difference of 0.020%), Immigrants from Nigeria (24.0%, a difference of 0.020%), Jamaican (24.0%, a difference of 0.090%), Ghanaian (24.1%, a difference of 0.18%), and Pennsylvania German (24.0%, a difference of 0.22%).
| Demographics | Rating | Rank | Disability Age 65 to 74 |
| French | 15.7 /100 | #212 | Poor 23.9% |
| Nicaraguans | 14.3 /100 | #213 | Poor 23.9% |
| Immigrants | Oceania | 13.6 /100 | #214 | Poor 24.0% |
| Pennsylvania Germans | 13.3 /100 | #215 | Poor 24.0% |
| Jamaicans | 12.2 /100 | #216 | Poor 24.0% |
| Immigrants | Portugal | 11.7 /100 | #217 | Poor 24.0% |
| Immigrants | Nigeria | 11.7 /100 | #218 | Poor 24.0% |
| Immigrants | Burma/Myanmar | 11.6 /100 | #219 | Poor 24.0% |
| Ghanaians | 10.4 /100 | #220 | Poor 24.1% |
| Immigrants | Nicaragua | 9.8 /100 | #221 | Tragic 24.1% |
| Native Hawaiians | 9.3 /100 | #222 | Tragic 24.1% |
| Immigrants | Middle Africa | 8.9 /100 | #223 | Tragic 24.1% |
| Immigrants | Panama | 8.6 /100 | #224 | Tragic 24.1% |
| Bermudans | 8.2 /100 | #225 | Tragic 24.2% |
| Iraqis | 8.1 /100 | #226 | Tragic 24.2% |