Cherokee vs Mexican Disability Age 65 to 74
COMPARE
Cherokee
Mexican
Disability Age 65 to 74
Disability Age 65 to 74 Comparison
Cherokee
Mexicans
28.2%
DISABILITY AGE 65 TO 74
0.0/ 100
METRIC RATING
320th/ 347
METRIC RANK
27.2%
DISABILITY AGE 65 TO 74
0.0/ 100
METRIC RATING
305th/ 347
METRIC RANK
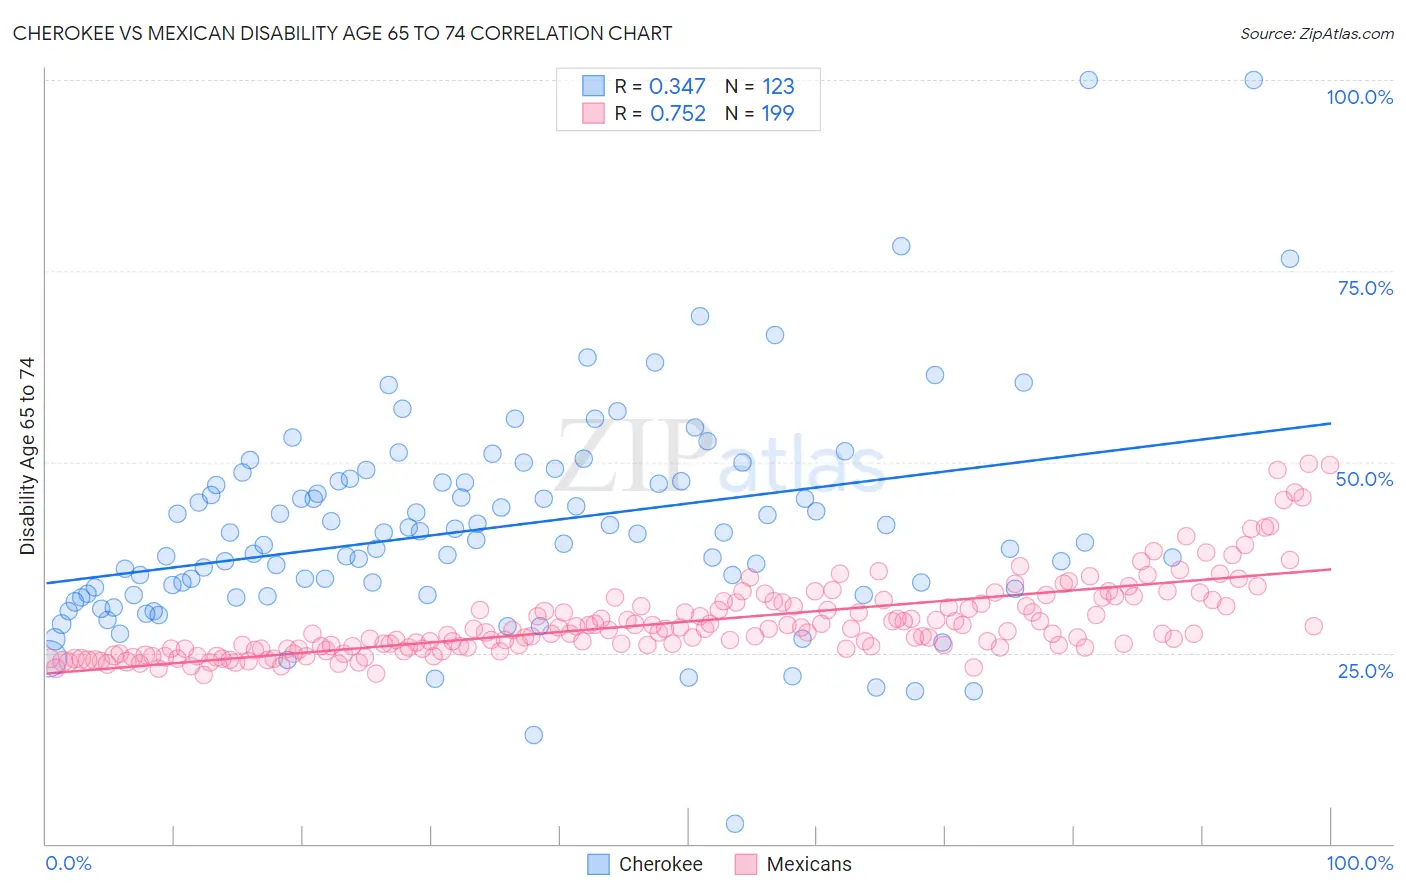
Cherokee vs Mexican Disability Age 65 to 74 Correlation Chart
The statistical analysis conducted on geographies consisting of 492,470,212 people shows a mild positive correlation between the proportion of Cherokee and percentage of population with a disability between the ages 65 and 75 in the United States with a correlation coefficient (R) of 0.347 and weighted average of 28.2%. Similarly, the statistical analysis conducted on geographies consisting of 562,869,209 people shows a strong positive correlation between the proportion of Mexicans and percentage of population with a disability between the ages 65 and 75 in the United States with a correlation coefficient (R) of 0.752 and weighted average of 27.2%, a difference of 3.7%.
Disability Age 65 to 74 Correlation Summary
| Measurement | Cherokee | Mexican |
| Minimum | 2.6% | 22.0% |
| Maximum | 100.0% | 49.7% |
| Range | 97.4% | 27.7% |
| Mean | 41.4% | 29.1% |
| Median | 39.7% | 27.6% |
| Interquartile 25% (IQ1) | 32.6% | 25.5% |
| Interquartile 75% (IQ3) | 47.4% | 31.4% |
| Interquartile Range (IQR) | 14.8% | 5.9% |
| Standard Deviation (Sample) | 14.2% | 5.2% |
| Standard Deviation (Population) | 14.1% | 5.2% |
Demographics Similar to Cherokee and Mexicans by Disability Age 65 to 74
In terms of disability age 65 to 74, the demographic groups most similar to Cherokee are Arapaho (28.1%, a difference of 0.39%), Comanche (28.3%, a difference of 0.51%), Nepalese (28.0%, a difference of 0.62%), Immigrants from Armenia (28.0%, a difference of 0.84%), and Aleut (28.4%, a difference of 0.84%). Similarly, the demographic groups most similar to Mexicans are Puget Sound Salish (27.2%, a difference of 0.10%), Tlingit-Haida (27.1%, a difference of 0.22%), Central American Indian (27.1%, a difference of 0.28%), Black/African American (27.3%, a difference of 0.40%), and Ute (27.3%, a difference of 0.46%).
| Demographics | Rating | Rank | Disability Age 65 to 74 |
| Central American Indians | 0.0 /100 | #302 | Tragic 27.1% |
| Tlingit-Haida | 0.0 /100 | #303 | Tragic 27.1% |
| Puget Sound Salish | 0.0 /100 | #304 | Tragic 27.2% |
| Mexicans | 0.0 /100 | #305 | Tragic 27.2% |
| Blacks/African Americans | 0.0 /100 | #306 | Tragic 27.3% |
| Ute | 0.0 /100 | #307 | Tragic 27.3% |
| Sioux | 0.0 /100 | #308 | Tragic 27.3% |
| Yaqui | 0.0 /100 | #309 | Tragic 27.4% |
| Shoshone | 0.0 /100 | #310 | Tragic 27.4% |
| Menominee | 0.0 /100 | #311 | Tragic 27.4% |
| Osage | 0.0 /100 | #312 | Tragic 27.5% |
| Paiute | 0.0 /100 | #313 | Tragic 27.8% |
| Chippewa | 0.0 /100 | #314 | Tragic 27.8% |
| Cajuns | 0.0 /100 | #315 | Tragic 27.9% |
| Crow | 0.0 /100 | #316 | Tragic 27.9% |
| Immigrants | Armenia | 0.0 /100 | #317 | Tragic 28.0% |
| Nepalese | 0.0 /100 | #318 | Tragic 28.0% |
| Arapaho | 0.0 /100 | #319 | Tragic 28.1% |
| Cherokee | 0.0 /100 | #320 | Tragic 28.2% |
| Comanche | 0.0 /100 | #321 | Tragic 28.3% |
| Aleuts | 0.0 /100 | #322 | Tragic 28.4% |