Trinidadian and Tobagonian vs Immigrants from Burma/Myanmar Disability Age 65 to 74
COMPARE
Trinidadian and Tobagonian
Immigrants from Burma/Myanmar
Disability Age 65 to 74
Disability Age 65 to 74 Comparison
Trinidadians and Tobagonians
Immigrants from Burma/Myanmar
23.9%
DISABILITY AGE 65 TO 74
16.4/ 100
METRIC RATING
210th/ 347
METRIC RANK
24.0%
DISABILITY AGE 65 TO 74
11.6/ 100
METRIC RATING
219th/ 347
METRIC RANK
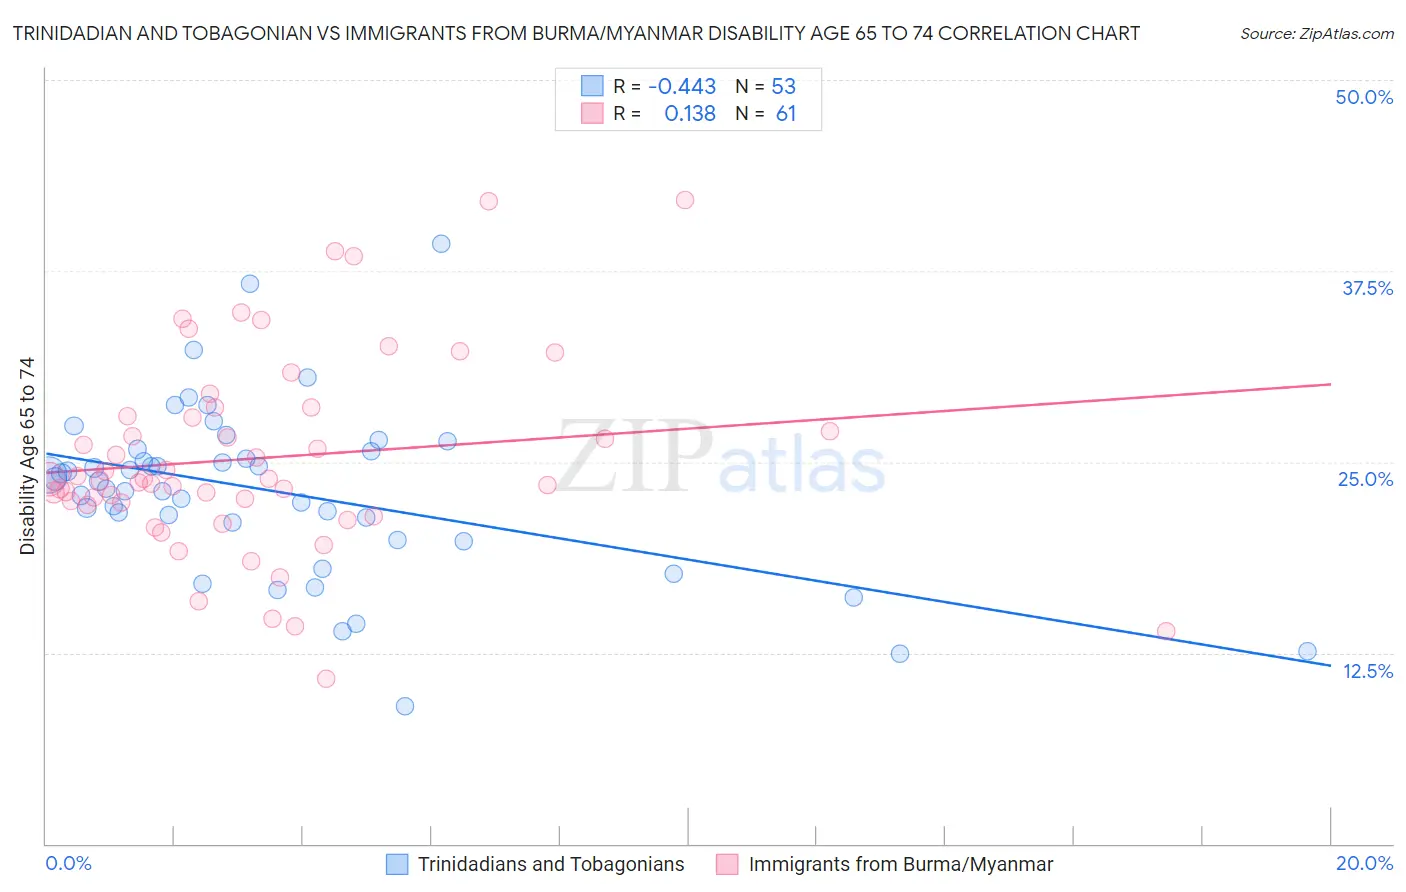
Trinidadian and Tobagonian vs Immigrants from Burma/Myanmar Disability Age 65 to 74 Correlation Chart
The statistical analysis conducted on geographies consisting of 219,459,404 people shows a moderate negative correlation between the proportion of Trinidadians and Tobagonians and percentage of population with a disability between the ages 65 and 75 in the United States with a correlation coefficient (R) of -0.443 and weighted average of 23.9%. Similarly, the statistical analysis conducted on geographies consisting of 172,172,101 people shows a poor positive correlation between the proportion of Immigrants from Burma/Myanmar and percentage of population with a disability between the ages 65 and 75 in the United States with a correlation coefficient (R) of 0.138 and weighted average of 24.0%, a difference of 0.57%.
Disability Age 65 to 74 Correlation Summary
| Measurement | Trinidadian and Tobagonian | Immigrants from Burma/Myanmar |
| Minimum | 9.0% | 10.8% |
| Maximum | 39.2% | 42.1% |
| Range | 30.2% | 31.3% |
| Mean | 23.1% | 25.3% |
| Median | 23.7% | 23.9% |
| Interquartile 25% (IQ1) | 20.5% | 22.3% |
| Interquartile 75% (IQ3) | 25.8% | 28.3% |
| Interquartile Range (IQR) | 5.3% | 6.0% |
| Standard Deviation (Sample) | 5.6% | 6.5% |
| Standard Deviation (Population) | 5.6% | 6.4% |
Demographics Similar to Trinidadians and Tobagonians and Immigrants from Burma/Myanmar by Disability Age 65 to 74
In terms of disability age 65 to 74, the demographic groups most similar to Trinidadians and Tobagonians are Immigrants from West Indies (23.9%, a difference of 0.050%), French (23.9%, a difference of 0.070%), Nicaraguan (23.9%, a difference of 0.23%), Immigrants from Barbados (23.8%, a difference of 0.31%), and Immigrants from Kenya (23.8%, a difference of 0.31%). Similarly, the demographic groups most similar to Immigrants from Burma/Myanmar are Immigrants from Portugal (24.0%, a difference of 0.020%), Immigrants from Nigeria (24.0%, a difference of 0.020%), Jamaican (24.0%, a difference of 0.090%), Ghanaian (24.1%, a difference of 0.18%), and Pennsylvania German (24.0%, a difference of 0.22%).
| Demographics | Rating | Rank | Disability Age 65 to 74 |
| Immigrants | Grenada | 22.1 /100 | #204 | Fair 23.8% |
| Tongans | 20.8 /100 | #205 | Fair 23.8% |
| Immigrants | Jamaica | 20.7 /100 | #206 | Fair 23.8% |
| Immigrants | Sudan | 20.1 /100 | #207 | Fair 23.8% |
| Immigrants | Barbados | 19.6 /100 | #208 | Poor 23.8% |
| Immigrants | Kenya | 19.6 /100 | #209 | Poor 23.8% |
| Trinidadians and Tobagonians | 16.4 /100 | #210 | Poor 23.9% |
| Immigrants | West Indies | 15.9 /100 | #211 | Poor 23.9% |
| French | 15.7 /100 | #212 | Poor 23.9% |
| Nicaraguans | 14.3 /100 | #213 | Poor 23.9% |
| Immigrants | Oceania | 13.6 /100 | #214 | Poor 24.0% |
| Pennsylvania Germans | 13.3 /100 | #215 | Poor 24.0% |
| Jamaicans | 12.2 /100 | #216 | Poor 24.0% |
| Immigrants | Portugal | 11.7 /100 | #217 | Poor 24.0% |
| Immigrants | Nigeria | 11.7 /100 | #218 | Poor 24.0% |
| Immigrants | Burma/Myanmar | 11.6 /100 | #219 | Poor 24.0% |
| Ghanaians | 10.4 /100 | #220 | Poor 24.1% |
| Immigrants | Nicaragua | 9.8 /100 | #221 | Tragic 24.1% |
| Native Hawaiians | 9.3 /100 | #222 | Tragic 24.1% |
| Immigrants | Middle Africa | 8.9 /100 | #223 | Tragic 24.1% |
| Immigrants | Panama | 8.6 /100 | #224 | Tragic 24.1% |