Estonian vs Laotian Male Disability
COMPARE
Estonian
Laotian
Male Disability
Male Disability Comparison
Estonians
Laotians
11.4%
MALE DISABILITY
26.8/ 100
METRIC RATING
188th/ 347
METRIC RANK
10.6%
MALE DISABILITY
98.6/ 100
METRIC RATING
77th/ 347
METRIC RANK
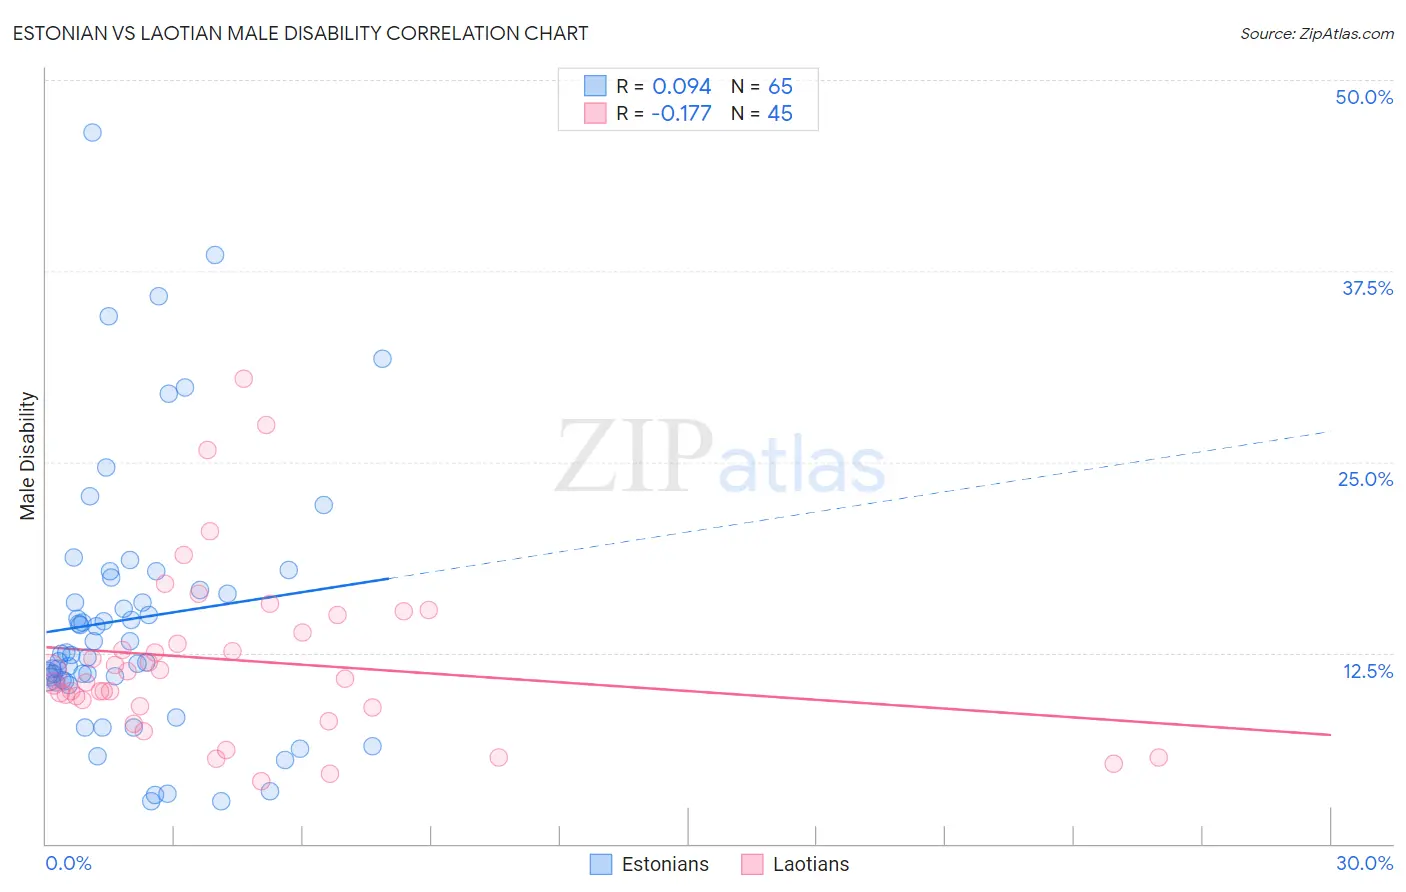
Estonian vs Laotian Male Disability Correlation Chart
The statistical analysis conducted on geographies consisting of 123,527,387 people shows a slight positive correlation between the proportion of Estonians and percentage of males with a disability in the United States with a correlation coefficient (R) of 0.094 and weighted average of 11.4%. Similarly, the statistical analysis conducted on geographies consisting of 224,854,560 people shows a poor negative correlation between the proportion of Laotians and percentage of males with a disability in the United States with a correlation coefficient (R) of -0.177 and weighted average of 10.6%, a difference of 7.8%.
Male Disability Correlation Summary
| Measurement | Estonian | Laotian |
| Minimum | 2.8% | 4.1% |
| Maximum | 46.6% | 30.4% |
| Range | 43.8% | 26.3% |
| Mean | 14.7% | 12.0% |
| Median | 12.5% | 10.8% |
| Interquartile 25% (IQ1) | 10.7% | 9.0% |
| Interquartile 75% (IQ3) | 17.0% | 14.4% |
| Interquartile Range (IQR) | 6.3% | 5.4% |
| Standard Deviation (Sample) | 8.7% | 5.7% |
| Standard Deviation (Population) | 8.7% | 5.6% |
Similar Demographics by Male Disability
Demographics Similar to Estonians by Male Disability
In terms of male disability, the demographic groups most similar to Estonians are Immigrants from Austria (11.4%, a difference of 0.040%), Immigrants from Zaire (11.4%, a difference of 0.060%), Immigrants from Netherlands (11.4%, a difference of 0.060%), Immigrants from Bosnia and Herzegovina (11.4%, a difference of 0.10%), and Pakistani (11.3%, a difference of 0.24%).
| Demographics | Rating | Rank | Male Disability |
| Immigrants | Senegal | 34.4 /100 | #181 | Fair 11.3% |
| Immigrants | Belize | 33.7 /100 | #182 | Fair 11.3% |
| Immigrants | Central America | 32.9 /100 | #183 | Fair 11.3% |
| Iraqis | 30.5 /100 | #184 | Fair 11.3% |
| Pakistanis | 30.3 /100 | #185 | Fair 11.3% |
| Immigrants | Zaire | 27.6 /100 | #186 | Fair 11.4% |
| Immigrants | Austria | 27.3 /100 | #187 | Fair 11.4% |
| Estonians | 26.8 /100 | #188 | Fair 11.4% |
| Immigrants | Netherlands | 25.9 /100 | #189 | Fair 11.4% |
| Immigrants | Bosnia and Herzegovina | 25.4 /100 | #190 | Fair 11.4% |
| Senegalese | 23.2 /100 | #191 | Fair 11.4% |
| Assyrians/Chaldeans/Syriacs | 23.2 /100 | #192 | Fair 11.4% |
| Greeks | 22.2 /100 | #193 | Fair 11.4% |
| Belizeans | 21.2 /100 | #194 | Fair 11.4% |
| Immigrants | Oceania | 20.9 /100 | #195 | Fair 11.4% |
Demographics Similar to Laotians by Male Disability
In terms of male disability, the demographic groups most similar to Laotians are Immigrants from Russia (10.6%, a difference of 0.020%), Immigrants from Sierra Leone (10.5%, a difference of 0.060%), Sierra Leonean (10.5%, a difference of 0.10%), Immigrants from Lebanon (10.5%, a difference of 0.21%), and Zimbabwean (10.6%, a difference of 0.25%).
| Demographics | Rating | Rank | Male Disability |
| Immigrants | Bulgaria | 99.1 /100 | #70 | Exceptional 10.5% |
| Immigrants | Cameroon | 99.0 /100 | #71 | Exceptional 10.5% |
| Immigrants | Serbia | 99.0 /100 | #72 | Exceptional 10.5% |
| Immigrants | Lithuania | 98.9 /100 | #73 | Exceptional 10.5% |
| Immigrants | Lebanon | 98.8 /100 | #74 | Exceptional 10.5% |
| Sierra Leoneans | 98.7 /100 | #75 | Exceptional 10.5% |
| Immigrants | Sierra Leone | 98.7 /100 | #76 | Exceptional 10.5% |
| Laotians | 98.6 /100 | #77 | Exceptional 10.6% |
| Immigrants | Russia | 98.6 /100 | #78 | Exceptional 10.6% |
| Zimbabweans | 98.4 /100 | #79 | Exceptional 10.6% |
| Immigrants | Jordan | 98.4 /100 | #80 | Exceptional 10.6% |
| Immigrants | Chile | 98.3 /100 | #81 | Exceptional 10.6% |
| Immigrants | Guyana | 98.2 /100 | #82 | Exceptional 10.6% |
| Immigrants | Poland | 98.1 /100 | #83 | Exceptional 10.6% |
| Bulgarians | 98.1 /100 | #84 | Exceptional 10.6% |